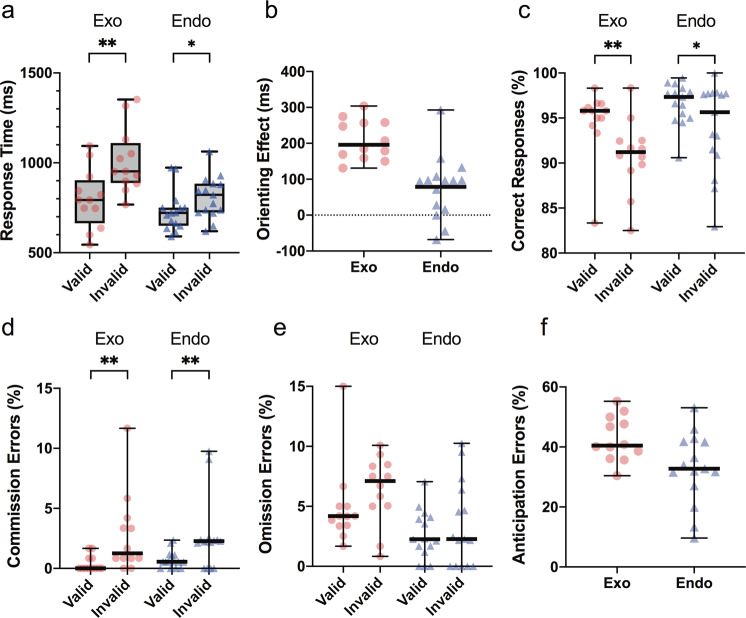
Fig. 3. Performance of mice following the completion of training in the exogenous task (Probe 3) and endogenous task (Probe 4).
a Response time, b orienting effect = median RT in invalid trials − median RT in valid trials, c correct responses, d commission errors, e omission errors and f anticipation errors. Data in a is expressed as box plots with the central line showing the median, box showing 25th–75th percentile, and whiskers showing min–max values. b–f are expressed as scatter plots with the bold horizontal line showing the median. *p < 0.05, **p < 0.001. Exogenous task: n = 12 mice; endogenous task: n = 15 mice.

