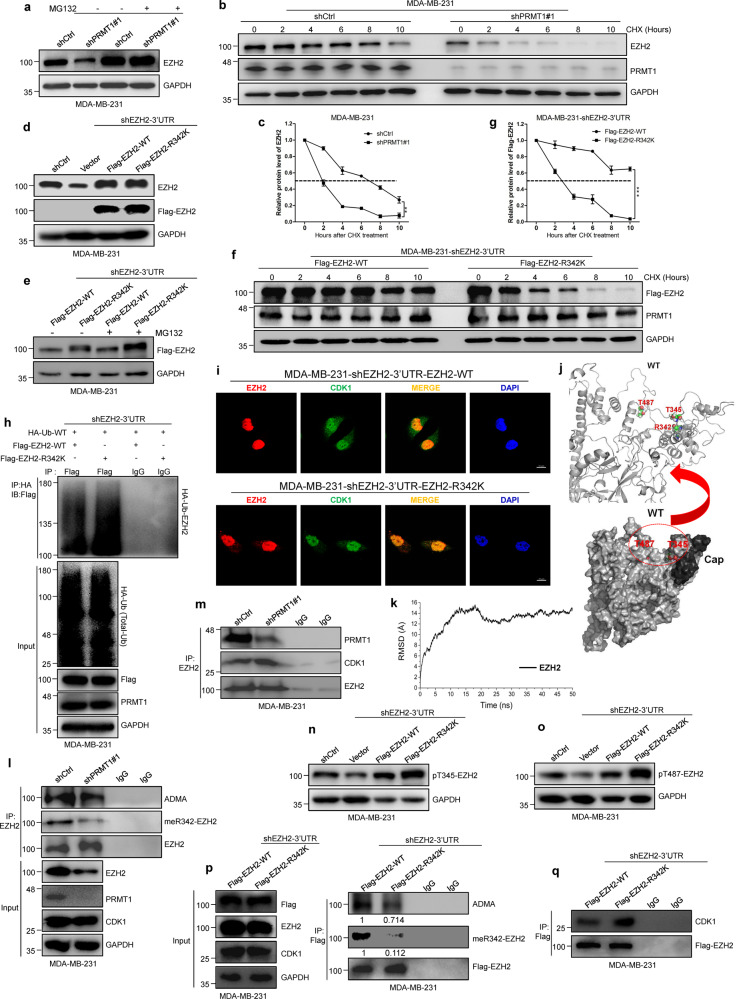
Fig. 3. PRMT1-mediated meR342-EZH2 inhibits CDK1-mediated EZH2 phosphorylation.
a The EZH2 protein expression was analyzed by western blot in shCtrl and shPRMT1 MM-231 cells after treated with MG132 (10 μM) for 2 h. b, c The EZH2 protein expression was detected by western blot in MM-231-shCtrl and MM-231-shPRMT1 cells following treated by CHX (50 μg/ml) for the indicated time (b). The relative intensity of EZH2 proteins were quantified by software Image J (c). For normalization, GAPDH expression was used as a control. d Western blot assays confirmed the overexpression of Flag-tagged EZH2 WT or R342K after knockdown of endogenous EZH2 in MM-231 cells. e–g The EZH2 expression was detected by western blotting after stable expression of Flag-EZH2-WT or Flag-EZh2-R342K in MM-231-shEZH2 cells treated with MG132 (10 μM) (e) or CHX (50 μg/ml) (f), respectively. The bands of FLAG-EZH2 proteins treated by CHX were quantified by software Image J and plotted (g). h Western blots of Flag-EZH2-associated ubiquitination after IP HA-Ub in MM-231-shEZH2-WT cells and MM-231-shEZH2-R342K cells. i IF analysis of EZH2 and CDK1 in overexpression of EZH2 WT and EZH2-R342K mutant MM-231-shEZH2 cells, respectively. j A structural illustration of T345 and T487 residues location in EZH2 protein spatial structure by a reported human PRC2 complex crystal structure (PDB ID: 5HYN). k The root-mean-square deviation (RMSD) of Cα of EZH2 protein for the last 50 ns were calculated. l, m Immunoblots of endogenous EZH2-associated ADMA and meR342-EZH2, and EZH2 interaction with PRMT1 (l) and CDK1 (m) in shCtrl and shPRMT1 cells after IP-EZH2. n, o Western blotting analysis of pT345-EZH2 and pT487-EZH2 phosphorylation levels in Vector, Flag-EZH2-WT and Flag-EZH2-R342K groups in MM-231-shEZH2 cells. p, q Western blot analysis of EZH2-associated ADMA and meR342-EZH2 (p), and EZH2 binding with PRMT1 and CDK1 (q) after IP Flag-EZH2 in MMB-231-shEZH2-WT cells and MM-231-shEZH2-R342K cells. Data are represented as mean ± SEM of three independent experiments, and **p < 0.01, ***p < 0.001 (Student’s t test).

