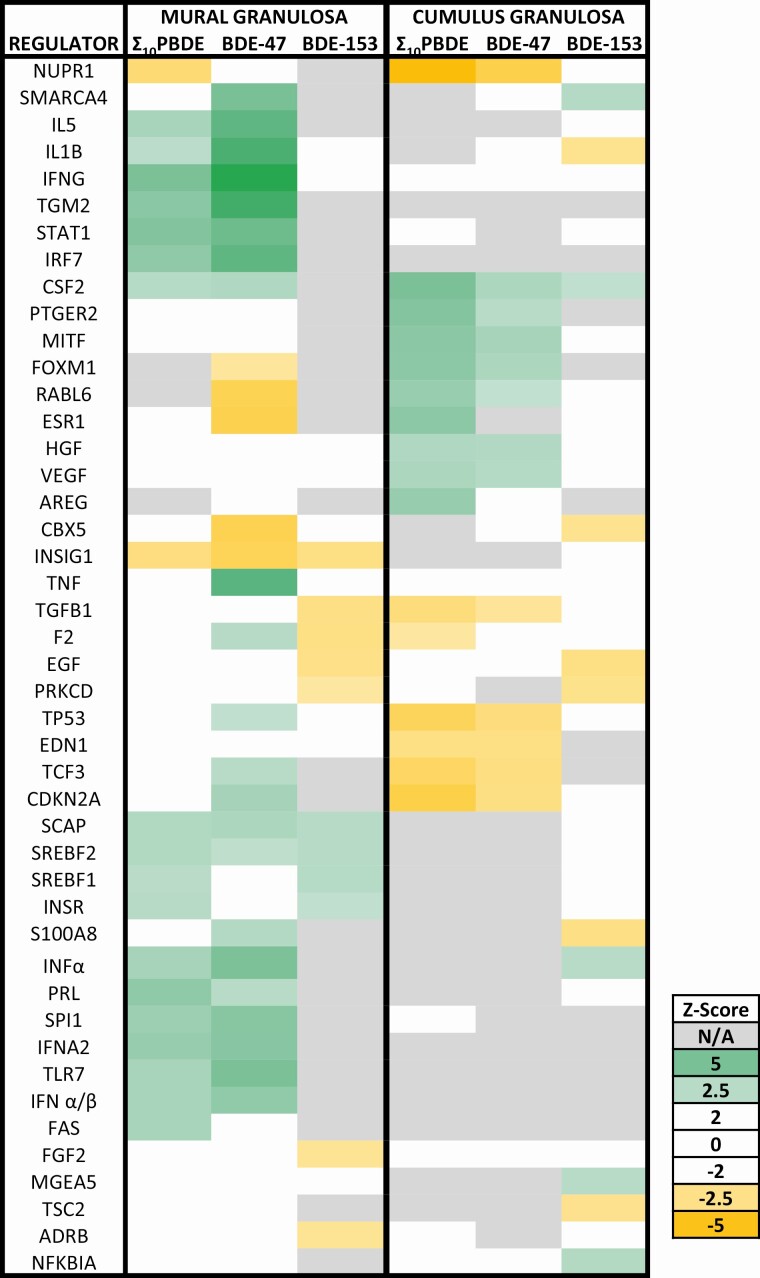
Figure 6.
Based on differential gene expression, predictions were made as to the status of upstream regulators of gene expression. Those in green are predicted to be activated, whereas those in yellow are predicted to be inhibited. The calculated z score is a statistical measure of the match between the expected relationship direction and the observed gene expression. Values greater than 2 or less than –2 are considered significant. When there are not enough data in the data set to make a prediction, the box is undefined (gray), whereas when there is no correlation between the observed data set and the expected relationship, the calculated z score is zero (white).

