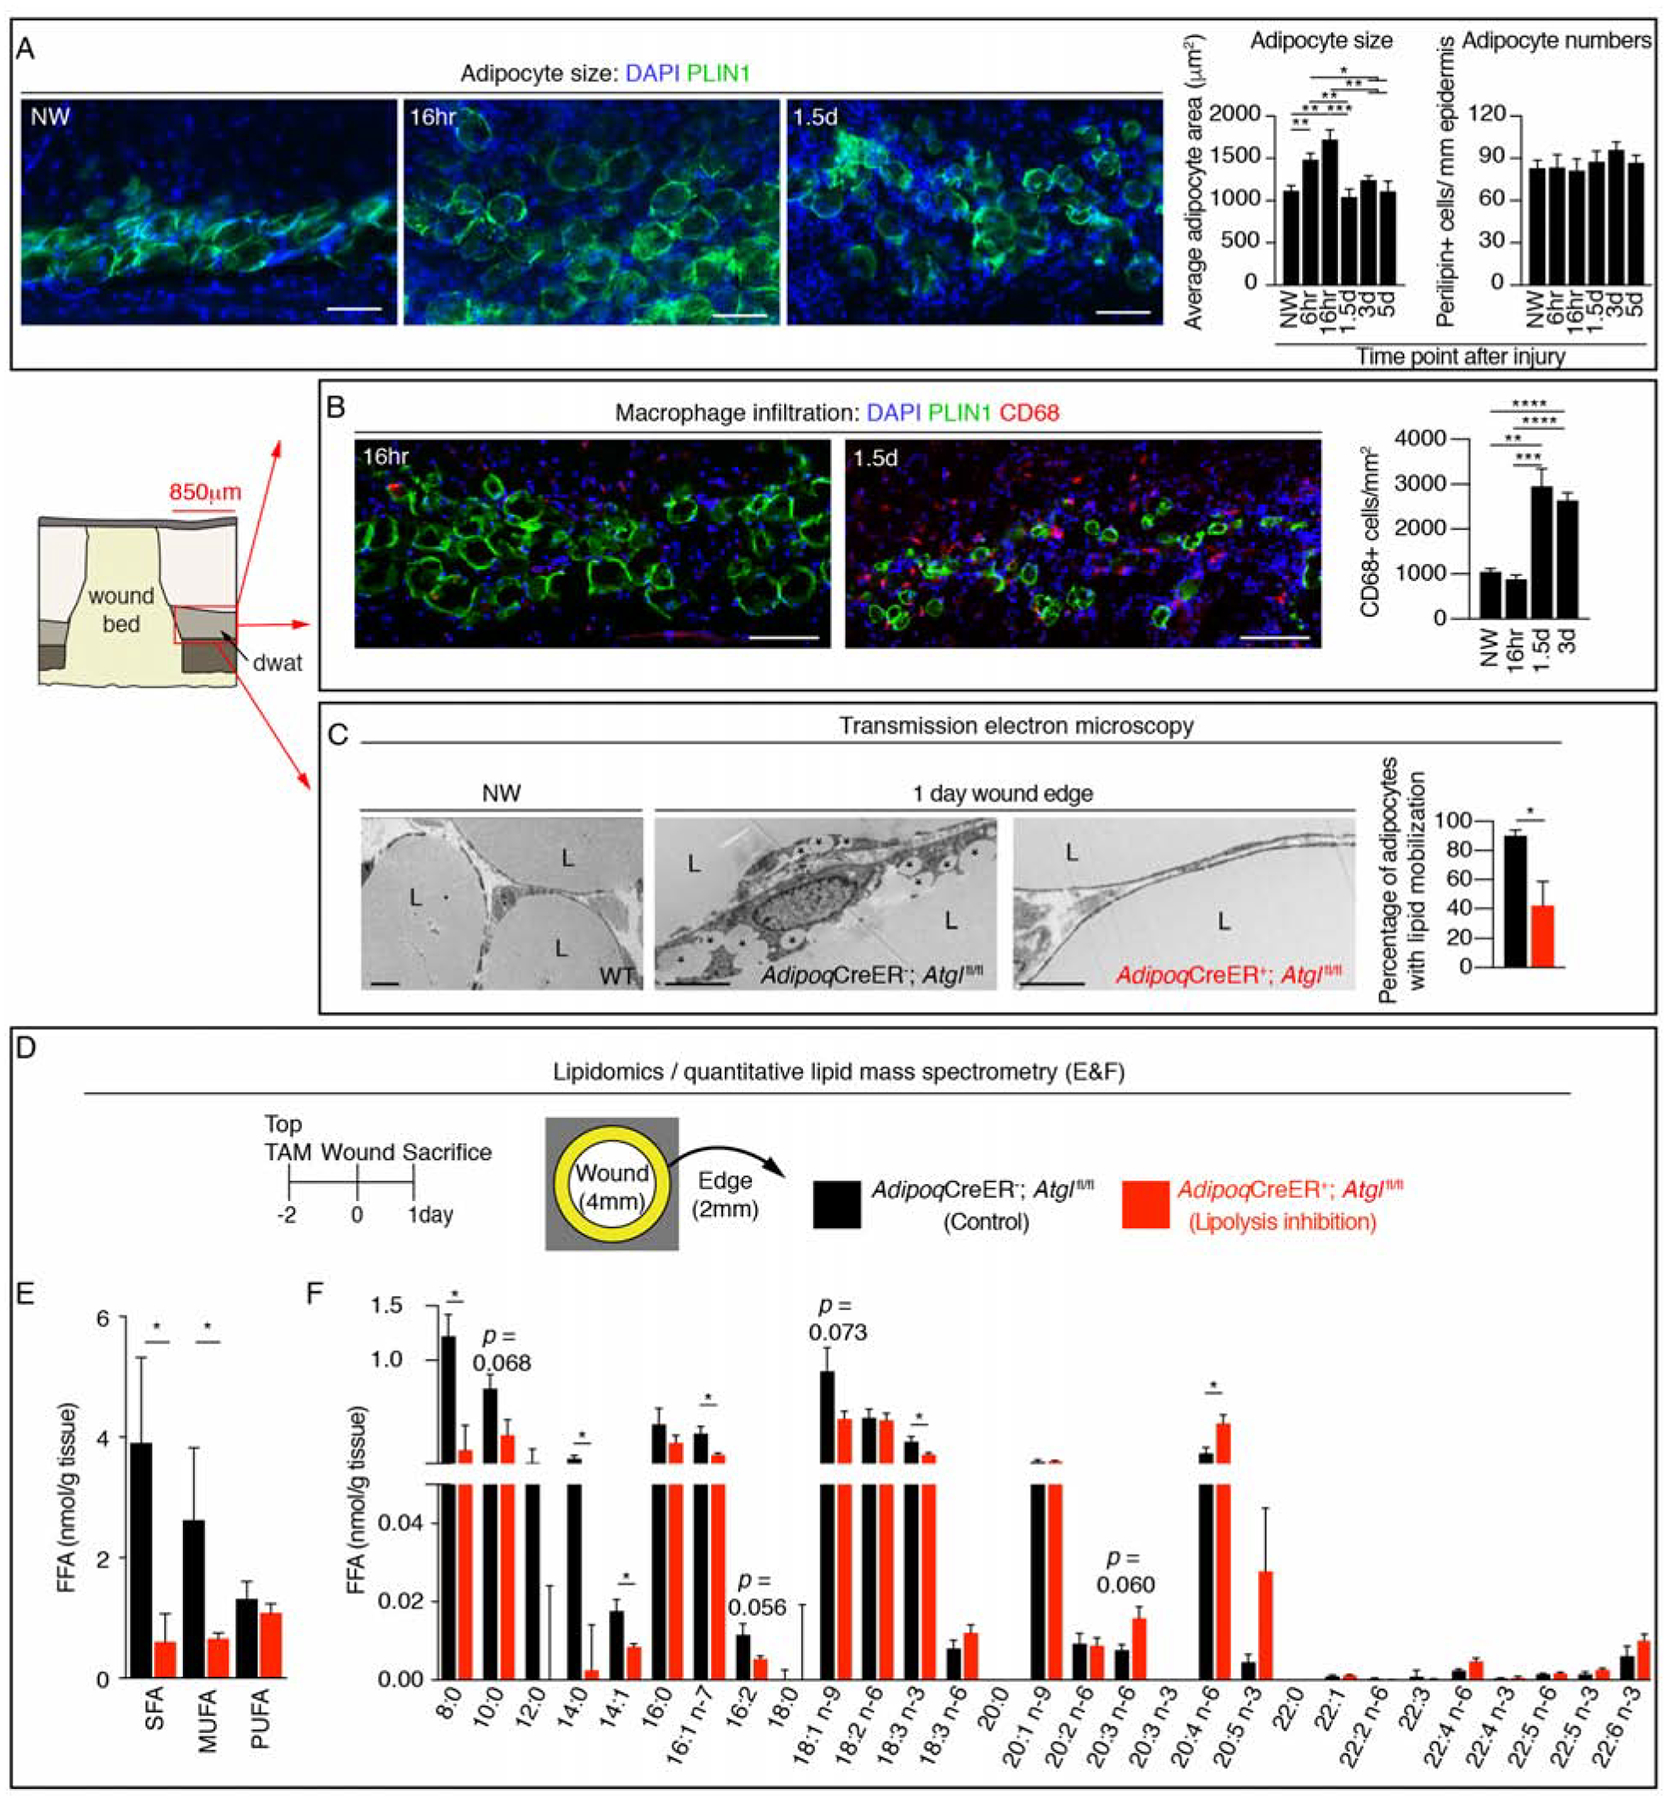
Figure 2. Dermal adipocytes undergo lipolysis after injury.

(A) Representative PLIN1 immunostained images of DWAT at the periphery of wounds and quantification of adipocyte cross sectional area and numbers (n ≥ 6 mice each time point). Scale bars, 100μm. (B) Representative immunostained images and quantification of CD68+ cells at the periphery of wound beds and in non-wounded (NW) skin (n ≥ 6 mice each time point). Scale bars, 100μm. (C) Transmission electron microscopy of adipocytes in uninjured skin and adipocytes at the wound periphery 1 day after injury. Asterisks show small lipid droplets. Quantification of adipocytes containing small lipid droplets at the periphery of a larger lipid droplet (n = 4 mice each condition). Scale bars, 5μm. (D) Experimental approach for quantitative lipidomics. (E–F) Lipid mass spectrometry quantification of non-esterified free fatty acid (FFA) classes (E) (n = 4–5 mice each condition) and FFA species (F) (n = 4–5 mice each time point). L, lipid droplet; SFA, saturated fatty acid; MUFA, monounsaturated fatty acid; PUFA, polyunsaturated fatty acid. Error bars indicate mean ± SEM. *, p < 0.05; **, p < 0.01; ***, p < 0.001, ****, p < 0.0001.
See also Figure S3.
