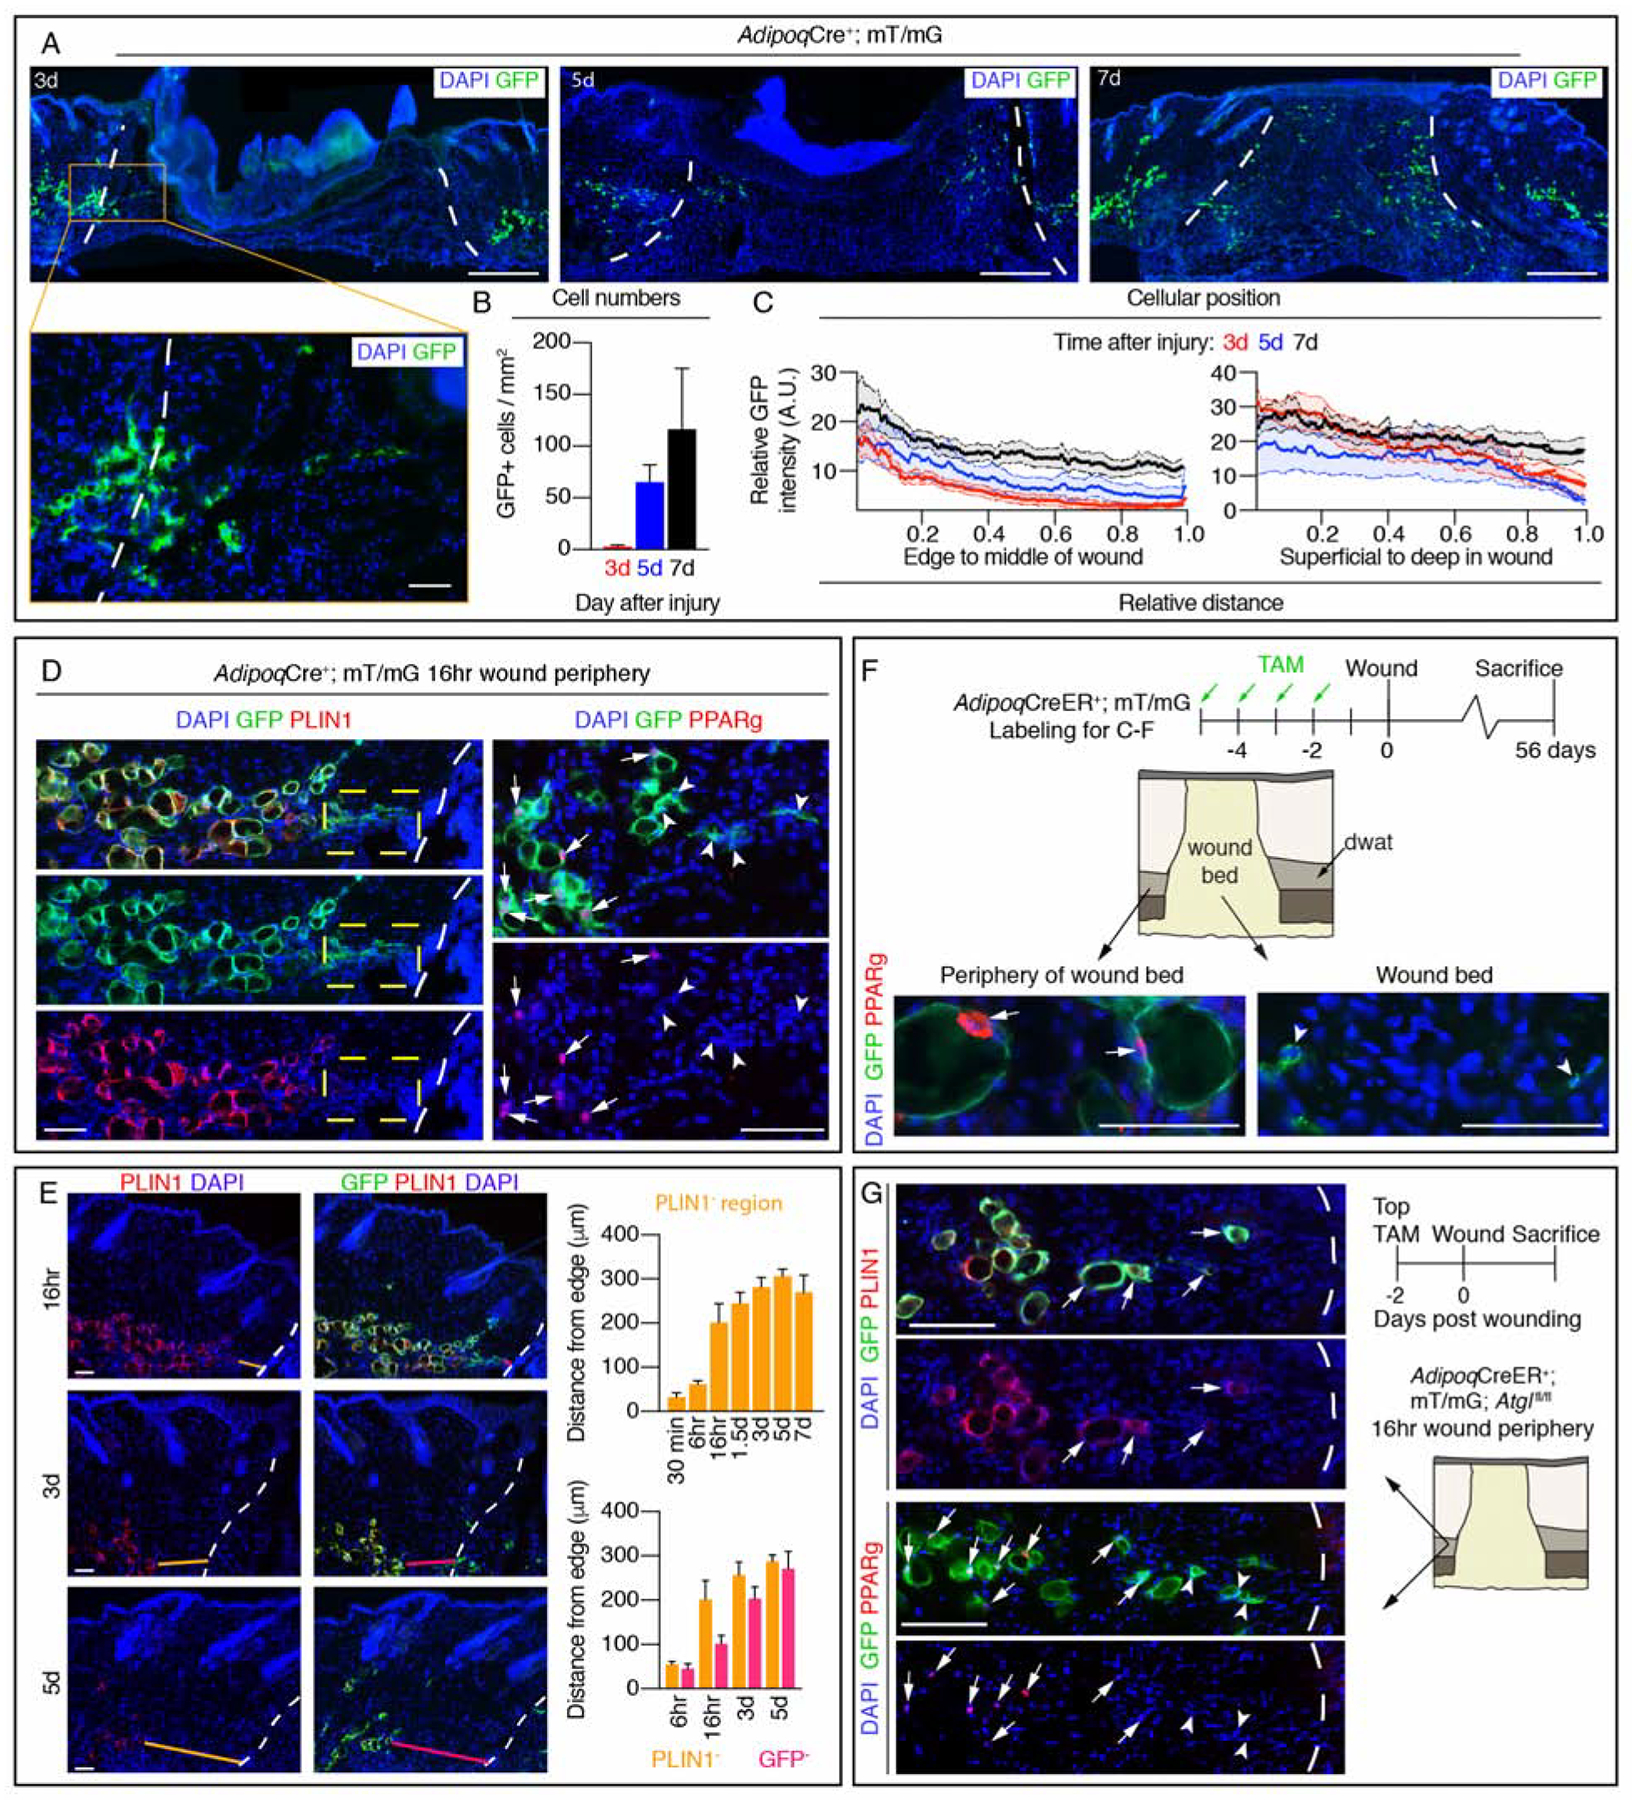
Figure 5. Adipocyte-derived cells in wound beds are long-lived and do not colocalize with adipocyte markers.

(A) Images of GFP in sections from the center of wound beds at different time points after injury. Scale bars, 500μm in lower magnification and 100μm in higher magnification (designated by orange box). (B) Quantification of GFP+ cells in wound beds (n = 4 mice each time point) and (C) the spatial distribution of GFP signal (n ≥ 7 mice each time point). (D) Colocalization of PLIN1 or PPARg with GFP+ adipocytes at the periphery of wounds 16-hours after injury. Dotted box indicates an area of GFP+ cells that lack PLIN1. Arrows indicate GFP+; PPARg+ cells, arrow heads indicate GFP+; PPARg− cells. Scale bars, 100μm. (E) PLIN1 and GFP immunostained images of DWAT and quantification of regions devoid of PLIN1 (orange lines) or GFP (magenta lines) at the periphery of wound beds at different time points after injury (n ≥ 6 mice each time point). Scale bars, 100μm. (F) Labeling scheme to identify long-lived AdipoqCreER-traced cells and PPARg staining. Arrows indicate GFP+; PPARg+ cells, arrow heads indicate GFP+; PPARg− cells. Scale bars, 50μm. (G) Immunostaining of PLIN1 or PPARg with GFP in wound periphery adipocytes from AdipoqCreER+; mT/mG; Atglfl/fl mice 16 hours after injury. Arrows indicate GFP+; PLIN1+ or GFP+; PPARg+ cells, arrow heads indicate GFP+; PPARg− cells. Scale bars, 200μm. White dotted lines delineate the wound edge. A.U., arbitrary units. Error bars indicate mean ± SEM.
See also Figure S5.
