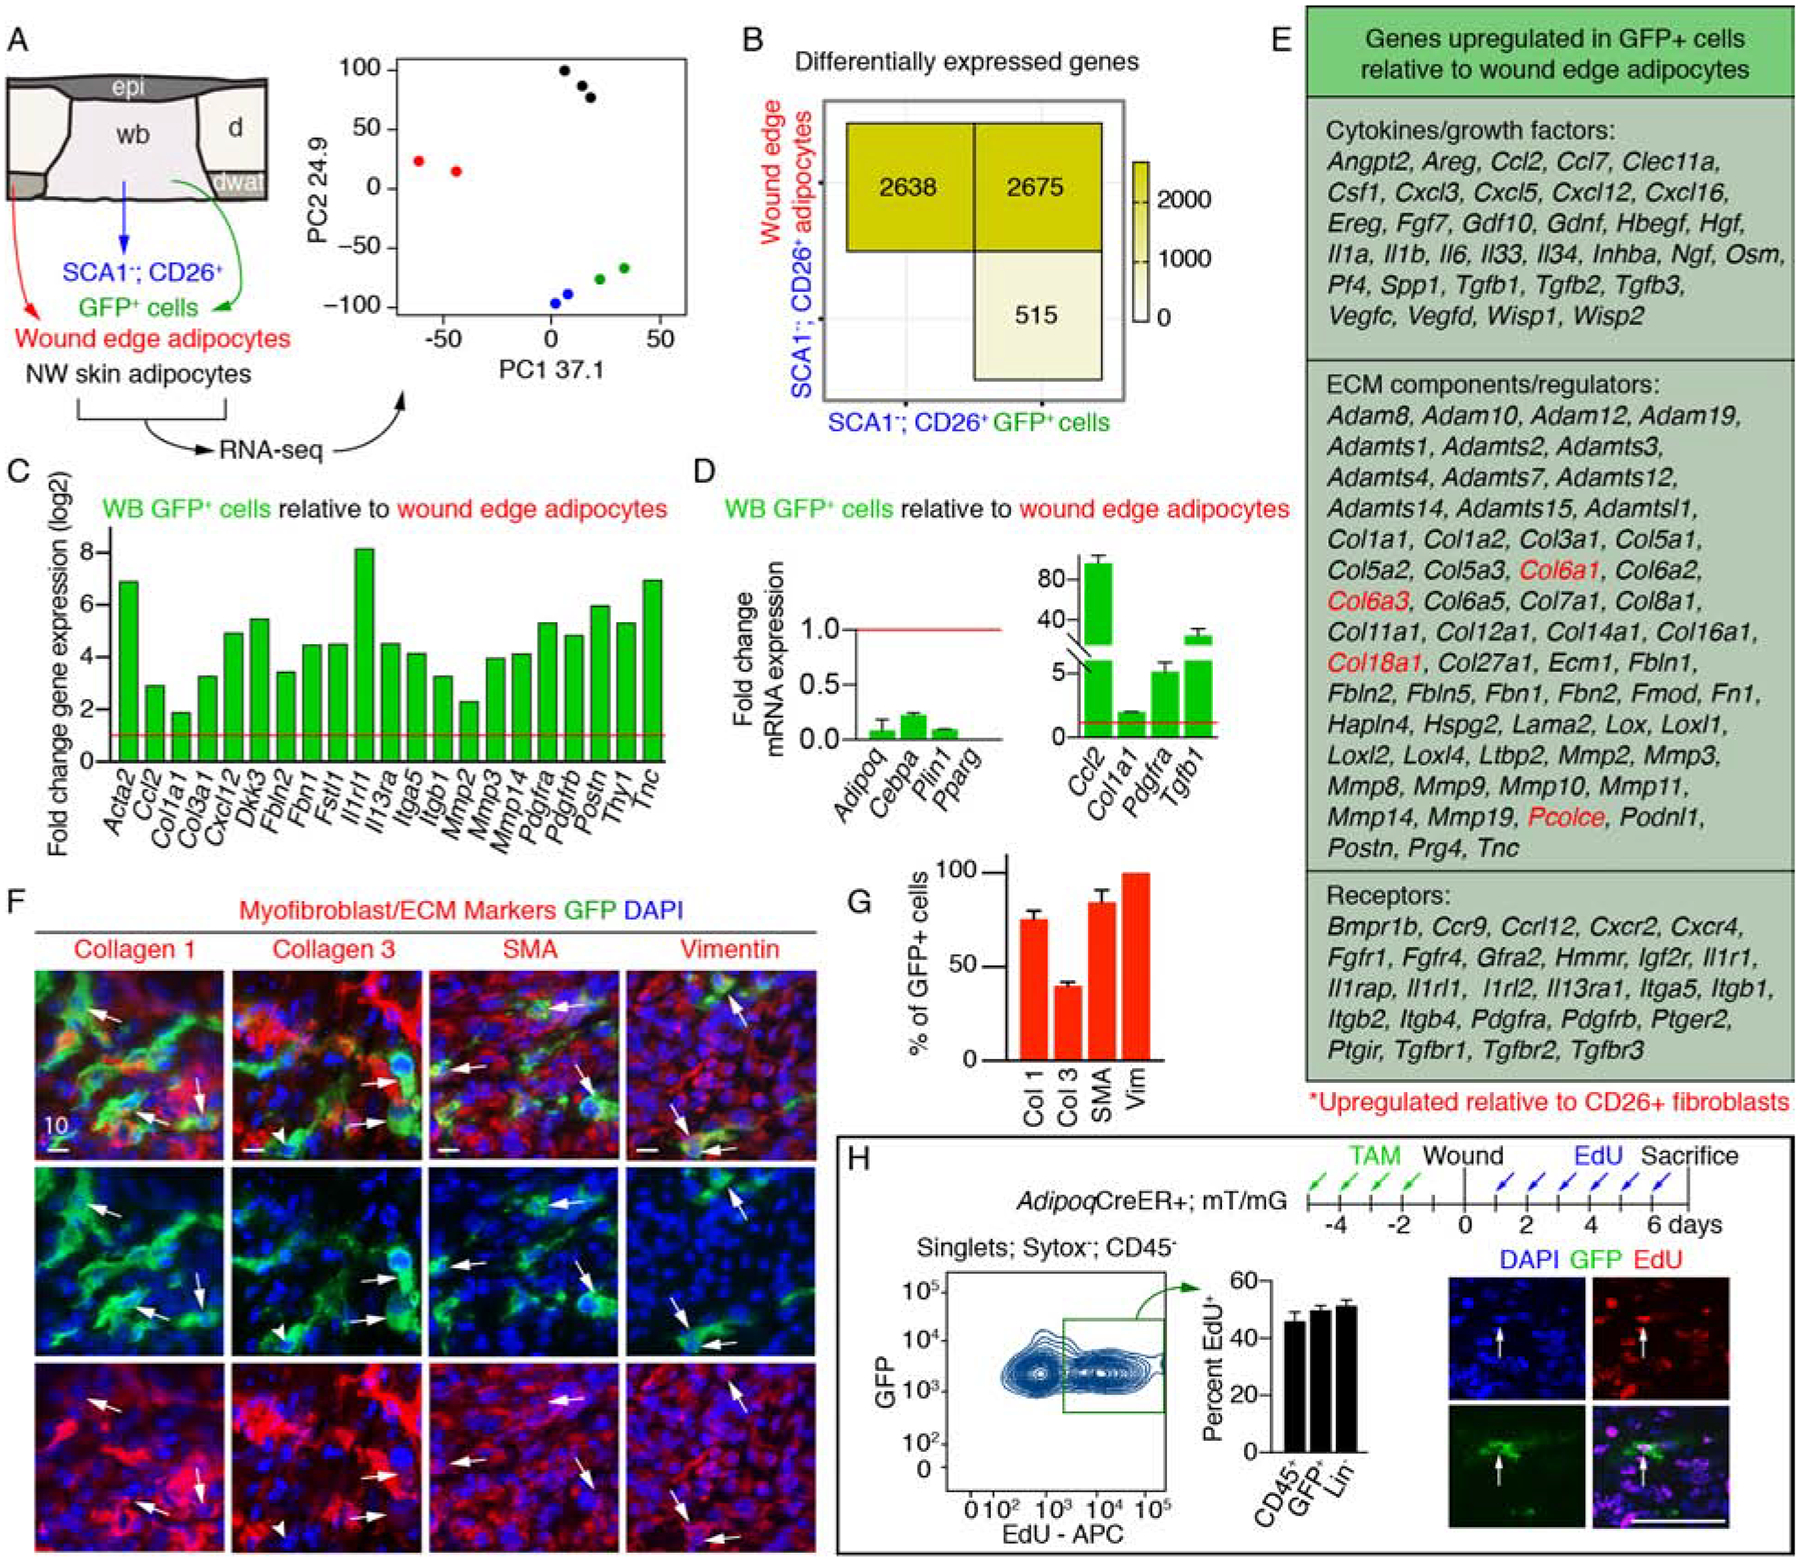
Figure 6. Adiponectin traced cells gain a myofibroblast gene expression profile during skin repair.

(A) Schematic and principal component (PC) analysis of cell populations isolated for RNA-seq. (B) Number of differentially expressed genes between cellular subsets. (C) Fold change in gene expression of myofibroblast-associated genes in GFP+ cells relative to wound edge/periphery adipocytes. Data from RNA-seq. (D) Quantitative real-time PCR of adipocyte signature genes (left) and myofibroblast genes (right) in GFP+ cells relative to wound periphery adipocytes (n = 3 mice). (E) Genes upregulated in GFP+ cells relative to wound edge adipocytes. Genes in red are also enriched compared to CD26+ myofibroblasts. (F–G) Images from day 5 wounds of AdipoqCre+; mT/mG mice (F) and quantification (G) of GFP+ cell colocalization with myofibroblast-associated markers (n = 3–5 mice). Scale bars, 10μm. (H) Flow cytometry plot and quantification of EdU+ cells (n = 3 mice). Scale bar, 100μm. Error bars indicate mean ± SEM. Epi, epidermis; d, dermis; dwat, dermal white adipose tissue; WB, wound bed.
See also Figure S6.
