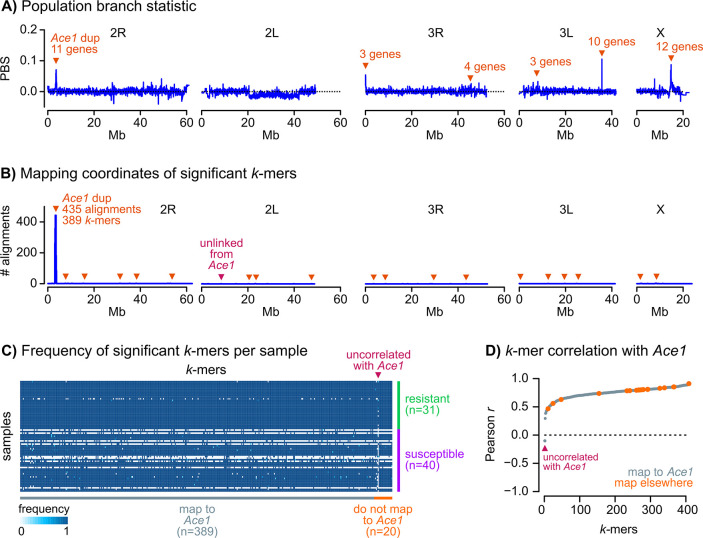
Fig 5. Genome-wide scan of variants associated with pirimiphos-methyl resistance in Ivorian A. coluzzii.
A) Profile of population branching statistics along all chromosomal arms, calculated in consecutive blocks of 1000 segregating variants, using resistant and susceptible Ivorian A. coluzzii as populations A and B, and Angolan A. coluzzii as outgroup. Orange triangles indicate windows with extreme PBS values (p-values derived from a standardised distribution of PBS along each chromosomal arm, and FDR < 0.001), and the number of genes therein. B) Mapping coordinates of k-mers significantly associated with pirimiphos-methyl (n = 439). Most k-mers map to the Ace1 duplication region (n = 414) or, despite mapping elsewhere in the genome (n = 24), are correlated with Ace1 copy number (orange triangles). Only one k-mer mapping outside of the Ace1 duplication is not correlated with Ace1 copy number (purple triangle). C) Normalised frequency of each significant k-mer (n = 439, horizontal axis) in each genome (n = 71, vertical axis). k-mers are sorted according to their mapping location (in Ace1 or elsewhere), and genomes are sorted according to their phenotype (resistant/susceptible). D) Pearson’s correlation coefficients (r) between k-mer frequency and number of Ace1 copies in each genome (n = 439 significant k-mers). k-mers are coloured according to their mapping location (in Ace1 or elsewhere) and sorted by the values of r.

