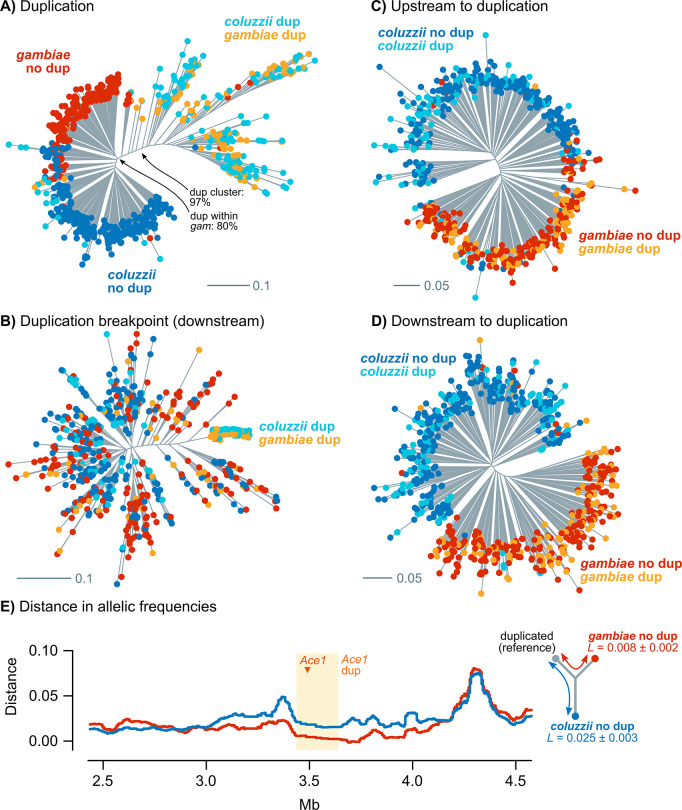
Fig 9. Phylogenetic analysis of introgression in Ace1.
A) Maximum-Likelihood phylogenetic analysis of 690 Western African haplotypes from the Ace1 duplicated region (2,787 phased variants), using a GTR model with ascertainment bias correction, empirical state frequencies and four Γ rate categories. B-D) Id., using variants beyond the downstream duplication breakpoint (512 variants) and 1Mb upstream and downstream of the duplication (3,935 and 3,302). Tips are color-coded according to species and duplication presence. Source alignments and complete phylogenies with supports in all nodes are available in S14 and S15 Data. E) Distance in allelic frequencies between groups of duplicated specimens and wt A. coluzzii and A. gambiae, calculated using the three-population branch statistic in windows of 5,000 variants along 2R (see Methods). Includes estimated branch lengths (L) from within the duplication region.

