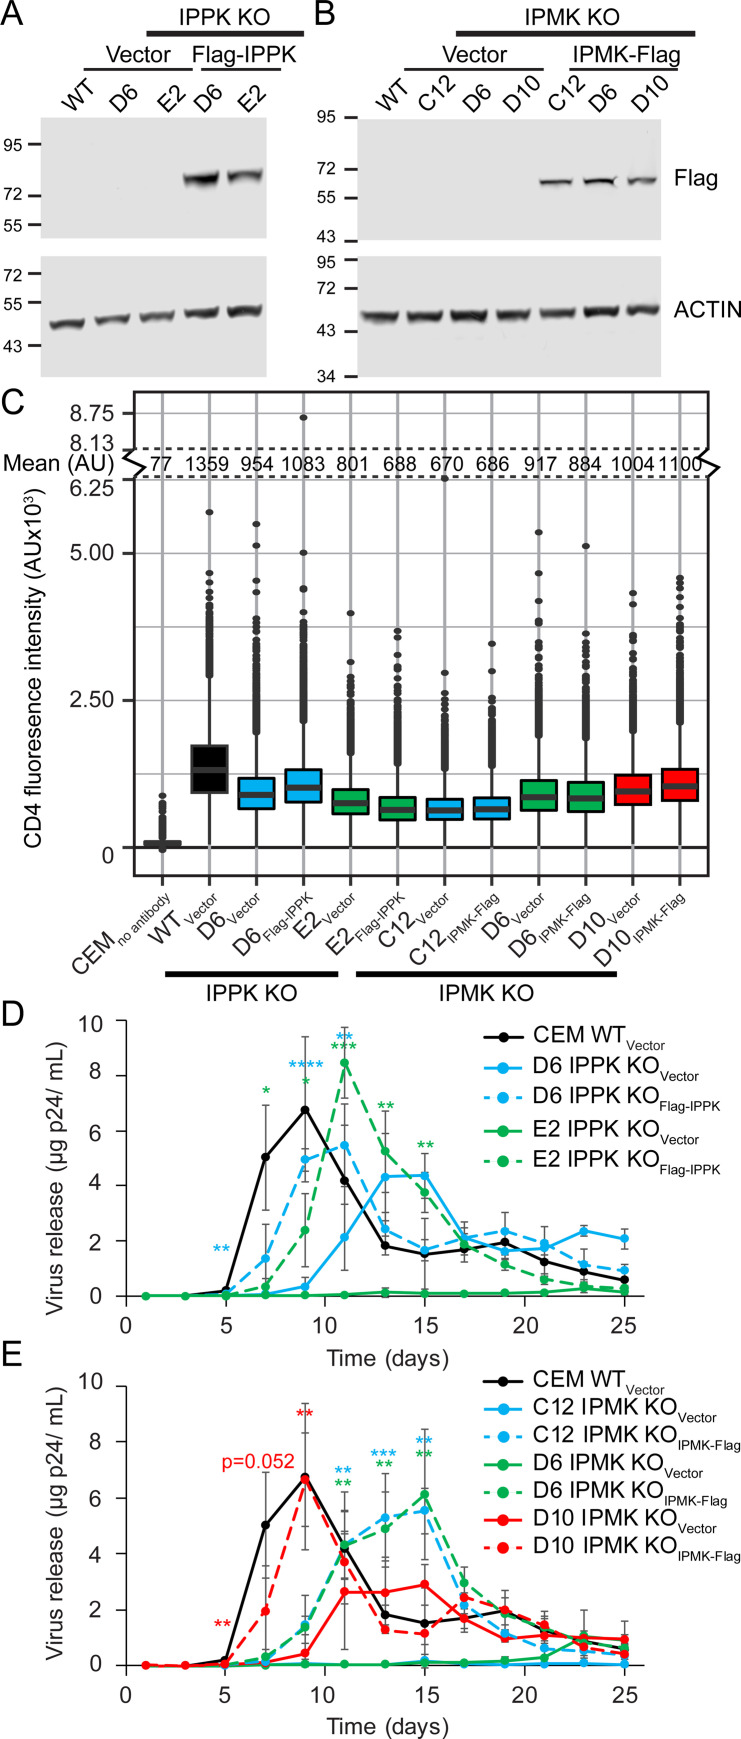
Fig 2. The effect of IPPK or IPMK KO on HIV-1 spread in CEM T cells.
A and B. Immunoblot of lysates from the denoted vector only or complemented cell lines. Reference molecular weight markers are shown to the left in kiloDaltons. C. Flow cytometry of extracellular CD4 expression in the denoted CEM cell lines is graphed on a box and whiskers. Box shows the 25th to 75th quartiles with the line denoting the median. Dots show outlier points. D and E. HIV-1 release plotted over time. Each point represents the average of 4 independent infections. Asterisks signify significance from the respective KOVector cell line. Significance levels: * p<0.05, ** p<0.01, *** p<0.001, **** p<0.0001.

