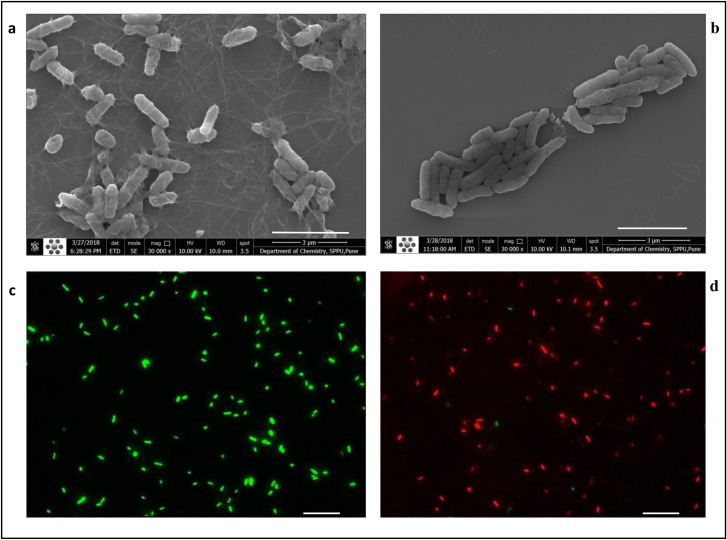
Fig 5. FESEM (at 30,000X magnification) and fluorescence microscopy (at 1000X magnification) of planktonic cells of PAW1.
FESEM of untreated PAW1 cells with extracellular matrix (a) and reduced numbers of acetic acid treated PAW1 cells showing shrunken cells with disrupted extracellular matrix (b). Fluorescence images of the same samples at 528 nm (green) for SYTO9 signal, 645 nm (red) for PI signal were merged. Viable cells (green) in untreated sample (c) and acetic acid treated sample shows dead cells (red) with very few live cells (green) (d). Bar lines in (a) and (b) indicate 3 μm while in (c) and (d) indicate 5 μm.

