Figure 1.

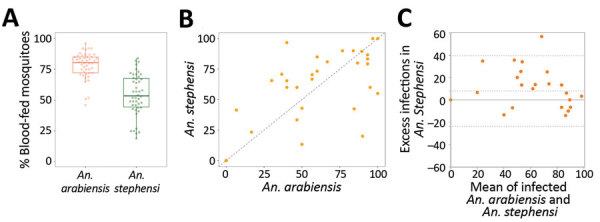
Comparison of feeding efficiency and infection rates for Anopheles stephensi and An. arabiensis mosquitoes in paired feeding experiments in study of An. stephensi mosquitoes as vectors of Plasmodium vivax and falciparum, Horn of Africa, 2019. A) Percentage of fully fed An. arabiensis mosquitoes (red) and An. stephensi mosquitoes (green). Box plots indicate median (midline), 25th (lower line), and 75th (upper line) percentiles of proportion of blood-fed mosquitoes. Whiskers indicate lower and upper 25% scores. Vertical lines indicate minimum and maximum values. B) Percentage of infected mosquitoes. C) Bland-Altman plot (difference plots) for mosquito infection rates in different mosquito species. Symbols indicate differences in infection rates in An. stephensi versus An. arabiensis (y-axis) mosquitoes in relation to mean infection rates in these 2 species (x-axis). Positive values (57.1%; 16/28) indicate a higher infection rate in An. stephensi mosquitoes; dotted lines indicate the 95% limits of agreement. There was no evidence that the correlation coefficient between the paired differences and means differed significantly from 0 (Pitman test of difference in variance, r = 0.026, p = 0.864).
