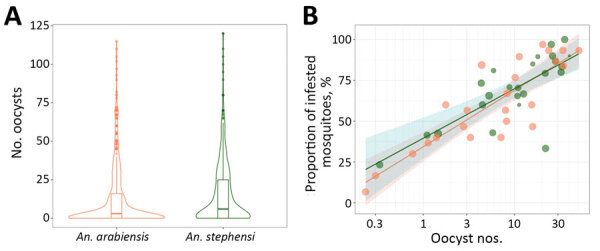
Figure 2.

Comparison of relative oocyst numbers and infection rate for Anopheles stephensi and An. arabiensis mosquitoes in paired feeding experiments in study of An. stephensi mosquitoes as vectors of Plasmodium vivax and falciparum, Horn of Africa, 2019. Number of oocysts per infected midgut for individual mosquitoes of each of the 2 species. A) Violin plot showing estimated kernel density. Horizontal lines indicate median; box indicates interquartile range; and spikes indicate upper and lower adjacent values. The proportion of midguts with detectable oocysts (y-axis) is indicated in association with log10 transformed oocyst numbers (x-axis) for An. stephensi (green dots) and An. arabiensis (orange dots) mosquitoes. B) Data for 24 feeding experiments in which 723 An. arabiensis and 643 An. stephensi mosquitoes were dissected. Shaded area indicates 95% CI around estimates for An. stephensi (green) and An. arabiensis (orange) mosquitoes.
