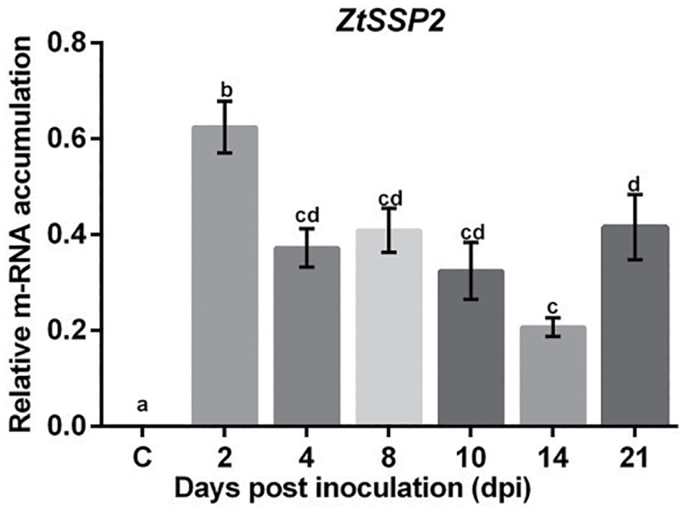
Fig. 3.
ZtSSP2 is expressed at different stages of Z. tritici infection (2–10 dpi biotrophic stage and 14–21 dpi necrotrophic stage). Gene expression analysis of ZtSSP2 uninfected control and at 2, 4, 8, 10, 14, and 21 dpi of wheat (cv. Remus) with Z. tritici isolate 560.11 (Lynch et al., 2016). Control plants were inoculated with Tween-20. RNA was extracted from three wheat leaves per time point followed by reverse transcription into cDNA. The qPCR was performed on cDNA using specific primers for ZtSSP2. The expression levels of β-tubulin (Z. tritici) were used to normalize the expression levels of ZtSSP2. Each independent experiment had three leaves each from three individual plants. The bars represent the mean relative expression ±SEM of three independently replicated experiments. Different letters above bars indicate significant differences, as determined by Tukey’s test (*P<0.05).

