
Extended Data Fig. 7. L-Tyr supplementation enhances octanol modulation.
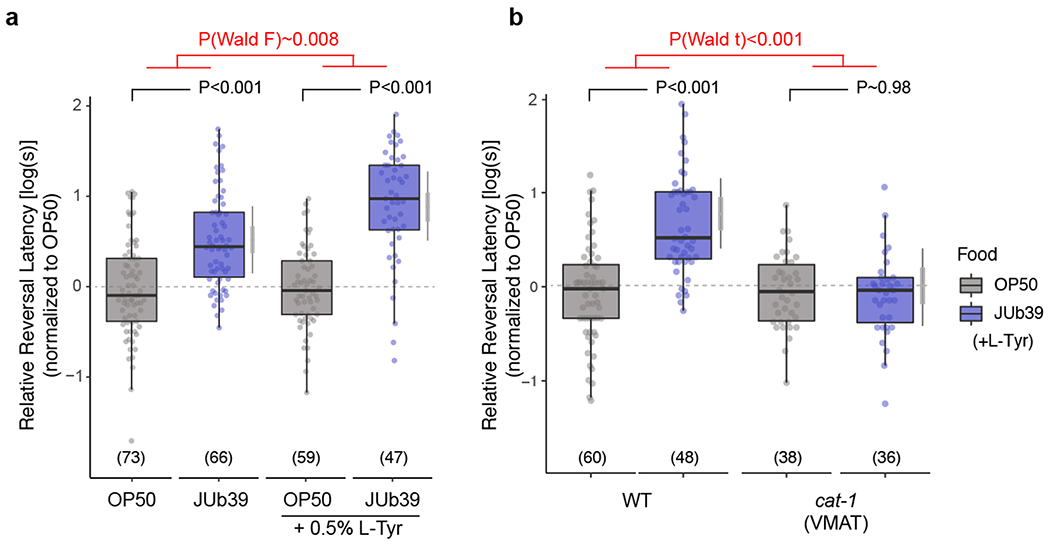
a-b, Reversal response times of animals of the indicated genotypes grown on the indicated bacteria in control conditions (a) or supplemented with 0.5% L-Tyr (a,b) to 100% octanol using SOS assays. Dots, response time of single worms. Y-axis is log10-scaled for these log-normal distributed data, and normalized to the indicated control group for each experimental day. Numbers in parentheses, number of worms tested in assays over at least 3 independent days. Boxplot, median and quartiles, whiskers, data range (excluding outliers). Gray thin and thick vertical bars, Bayesian 95% and 66% credible intervals for the difference of means, respectively. P-values indicating comparisons of means relative to the OP50 control for each conditions are from a LMM with Tukey-type multivariate-t adjustment. P-value in red indicates Wald F-statistic (a) or Wald t-statistic (b) for the effect of L-Tyr supplementation (a) or genotype (b) on the magnitude of the JUb39 effect. Wild-type data in (b) are also shown in Fig. 2g.