
Extended Data Fig. 8. Phylogenetic analysis of group II decarboxylase genes in Gammaproteobacteria.
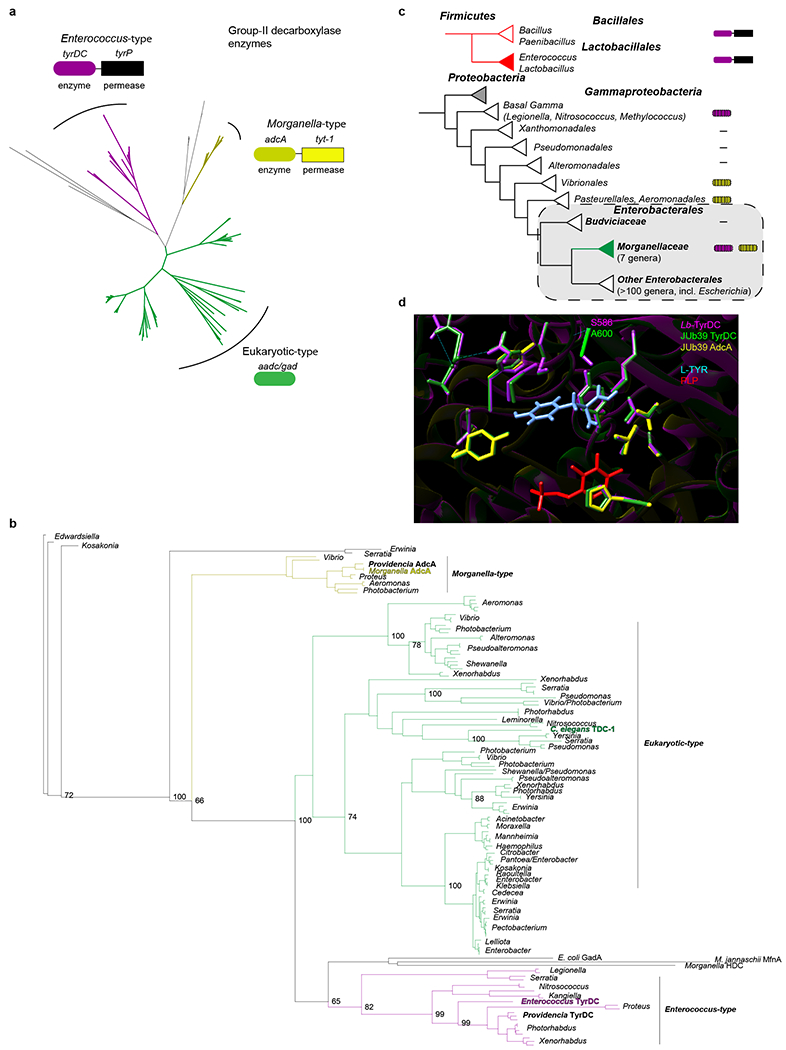
a, Neighbor-joining unrooted tree based on sequences identified via a BLAST search using Enterococcus faecalis TyrDC and C. elegans TDC-1. Initial tree indicates 3 major groups. Representative enzymes and operon structures for each group are indicated by colored boxes. b, Bootstrapped maximum likelihood phylogeny using PhyML and Phylomizer pipeline. Maximum of two highly similar sequences per genus were included after each BLAST search. Genera are indicated to the right. Numbers on branch-points matching this tree out of 100 bootstrap replicates are indicated at values >60. Group representatives from (a) are indicated in corresponding colors. Providencia and C. elegans sequences discussed in this work are indicated in bold. Accession numbers and BLAST metrics are listed in SI Table 1. c, Presence of tyrDC and adcA among complete genomes in Gammaproteobacteria. Linked boxes indicate organization in an operon. Hatched shading indicates variable presence among genera. Colored triangles indicate taxa of interest. d, Homology-based model of the TyrDC catalytic domain in Providencia based on the Lb-TyrDC crystal structure36 using SWISS-MODEL (https://swissmodel.expasy.org). Residues in magenta, green and yellow are from Lb-TyrDC, JUb39-TyrDC, and JUb39-AdcA, respectively. PLP is depicted in red and L-Tyr (manually docked for illustration) is indicated in light blue. Position of A600/S58636 in JUb39 TyrDC and Lb-TyrDC are indicated.