
Figure 2. Overview of the pMAT suite.
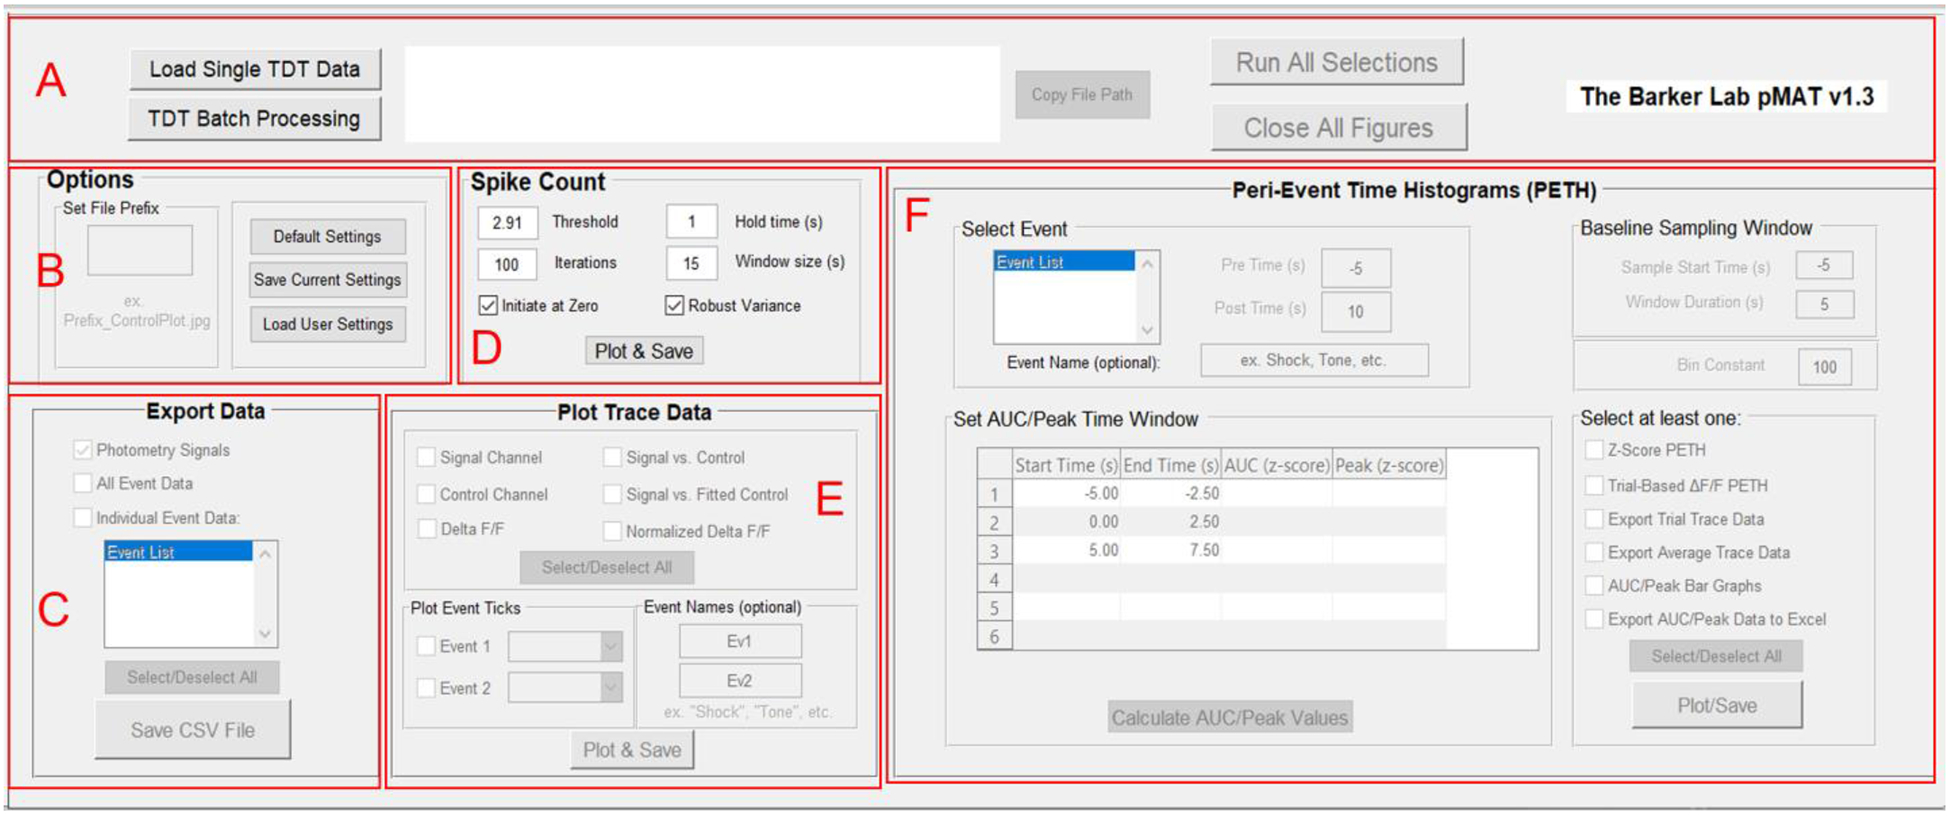
A) The control module allows for loading single files or batch processing and provides an interface of buttons to run selections across all modules or to close all of the figures generated when running the code.
B) The Options module is used for setting file prefixes as well as saving and loading pMAT options.
C) The Export Data module provides options for exporting signal, control, or event data into comma separated value (‘.CSV’) files that can be imported into other programs such as Microsoft Excel or R.
D) The Spike Count module allows users to conduct an iterative smoothing and reliable count of spikes or transients in their data.
E) The Plot Trace Data module allows for the plotting of signal and control channels, as well as the stepwise evaluation of the signal correction routines used to generate the ΔF/F. The module also allows for the visualization of events across time on the ΔF/F plots.
F) The Peri-Event Time Histogram module allows for the evaluation of the signal around an event of interest and provides the tools for the plotting and exporting of relevant data for the peri-event traces or summary statistics.