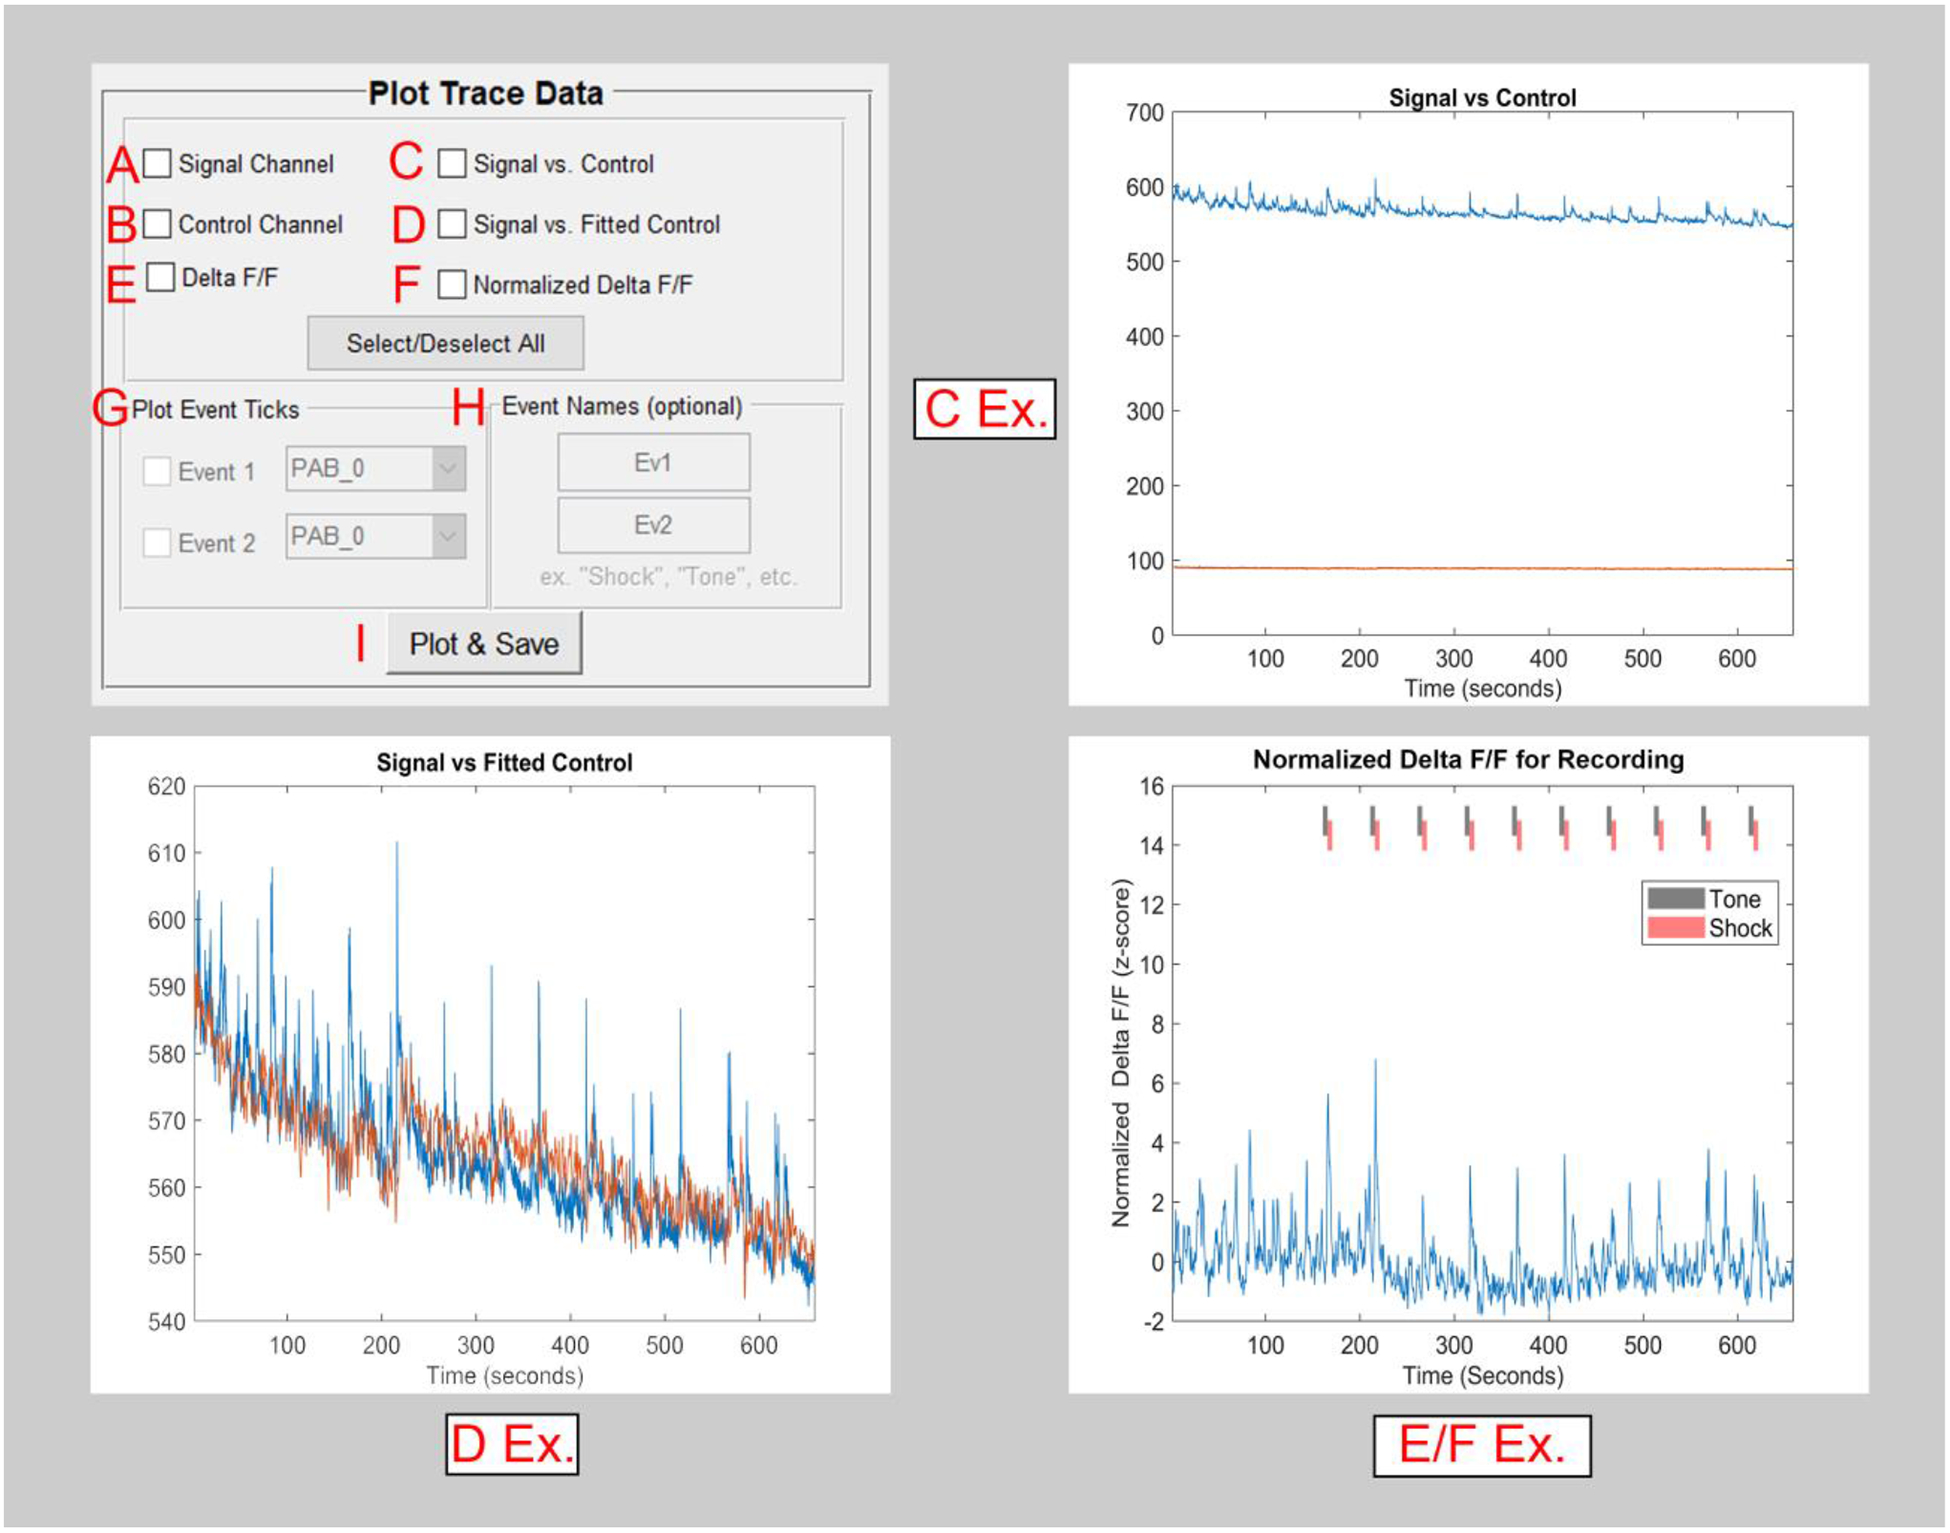
Figure 4. The pMAT trace plotting module.

A) The checkbox for the ‘Signal Channel’ will independently plot data from a recorded sensor.
B) The checkbox for the ‘Control Channel’ will independently plot data from an isosbestic or autofluorescence control.
C) The signal and control channels can be plotted simultaneously in order to compare the various properties of these signals (e.g., rate of photobleaching).
D) The fitted control is overlaid onto the signal channel (D Ex.) in order to help visualize the scaling that has occurred and the corrections that will be made.
E) The Δ F/F is generated using the signal and fitted control. This shows the final stage of the calculated correction that occurs using the control channel.
F) A normalized (z-score) version of the Δ F/F is generated.
G) The event checkboxes allow for the visualization of events across the whole-session trace data. (e.g., the Tone and Shock ticks in the E/F Ex.)
H) Events can be given a custom name, as desired.
I) All checkboxes selected in the Plot and Trace Data module are run using the Plot and Save button.
