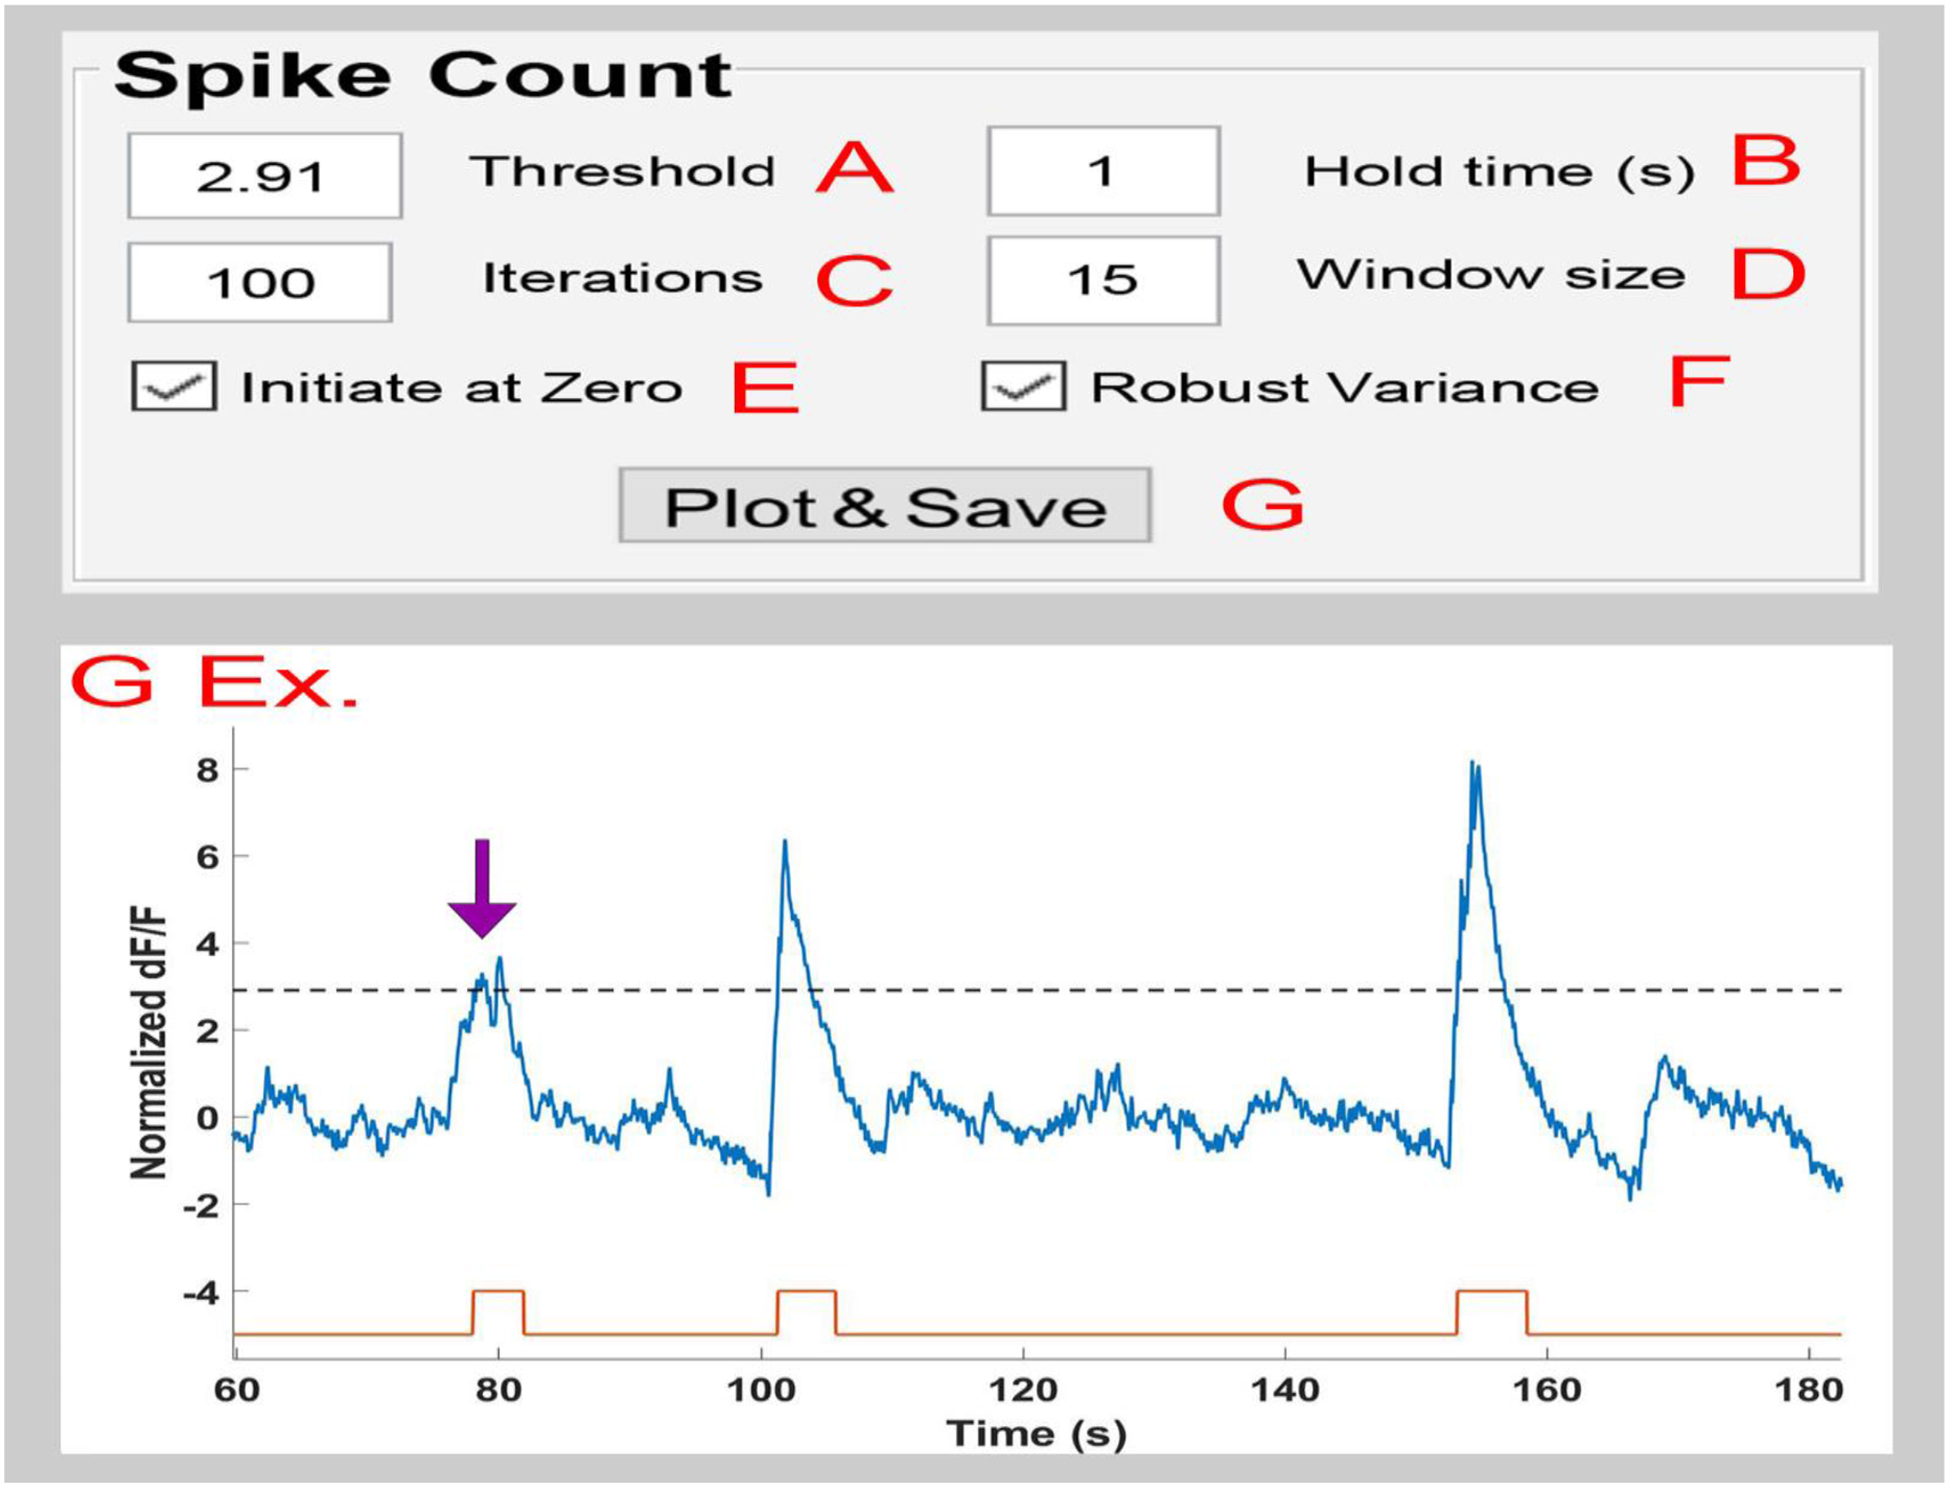
Figure 5. The pMAT Spike Count Module.

A) The ‘Threshold’ value sets the detection limit for counting spikes. This is represented by the dotted line in the returned plot (G Ex).
B) The ‘Hold Time’ value indicates the minimum amount of time that must exist between two events before counting them as separate. If multiple spikes occur during the hold time, they will be combined into a single event (purple arrow, G Ex.)
C) The ‘Iteration’ value determines the number of times that iterative de-bleaching will occur before averaging the results.
D) The ‘Window Size’ determines the bins of time used to center and normalize the data while creating the moving average.
E) The ‘Initialize at Zero’ checkbox indicates that spikes should be counted from the first zero value on the y-axis before a threshold crossing until the first zero value on the y-axis following the end of the spike.
F) The ‘Robust Variance’ checkbox employs a robust z-score approach using median absolute deviations when checked, and standard deviation when unchecked.
G) The ‘Plot & Save’ button initiates the spike detection using the settings from A-F and returns a plot showing the Δ F/F (blue trace), spike threshold (dotted line), and the start (black tick) and end (red tick) for each spike that was detected.
