
Figure 6. The pMAT peri-event time histogram module.
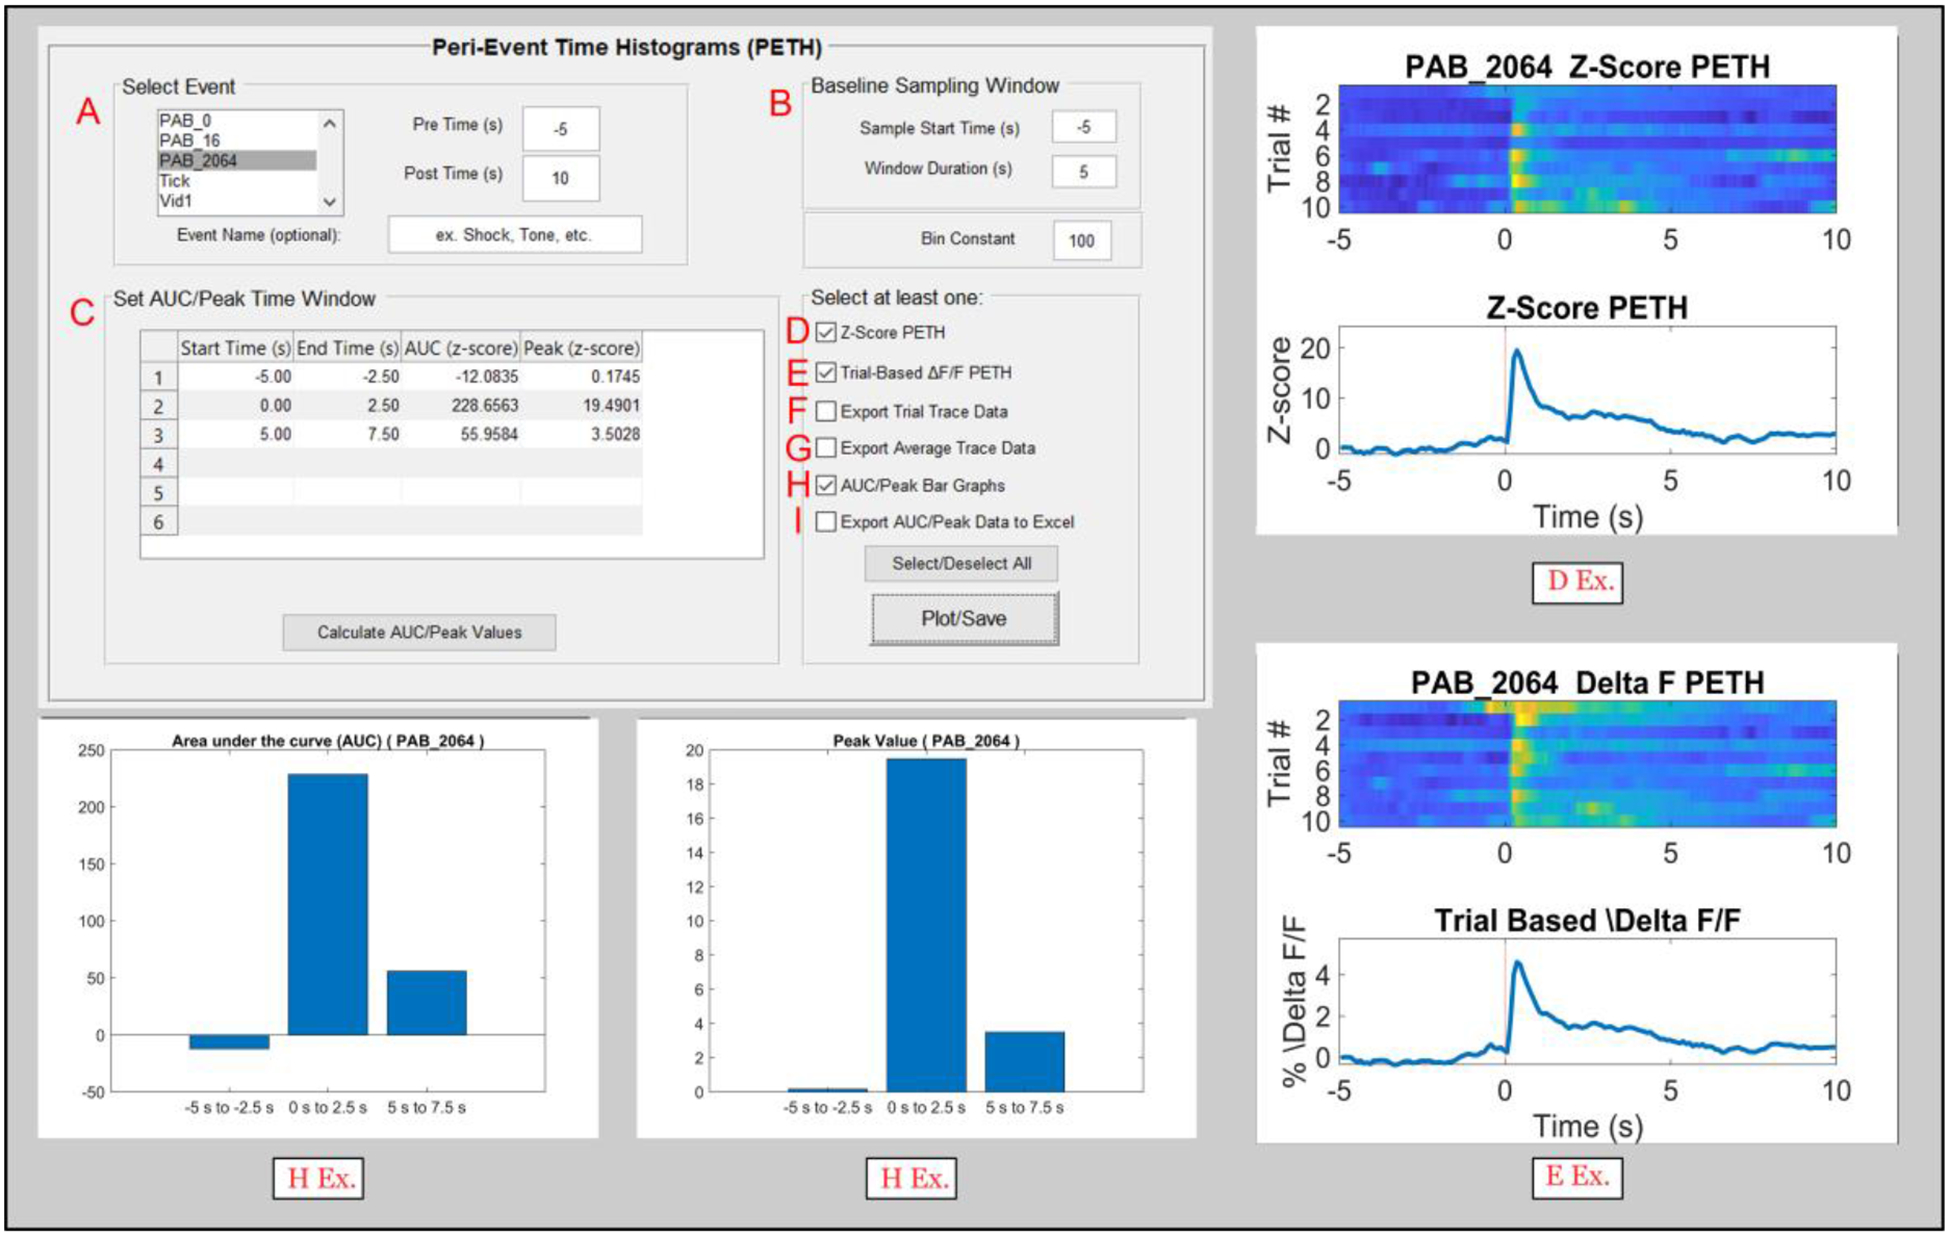
A) An event of interest can be selected to create a peri-event heatmap and histogram (PETH; D Ex. And E Ex.). A window of event before (Pre Time) and after (Post Time) can also be defined.
B) The user can then define a Baseline Sampling Window to act as a reference point for normalizing (robust z-score) data. In addition, a bin size for the event and baseline data can be defined.
C) The area under the curve (AUC) and ‘Peak’ or maximum value of a trace are two commonly used metrics collected for fiber photometry data. Users can input up to 6 values for the start and end times of specific windows and the AUC and Peak will be calculated for each of these windows. These values can also be plotted using the checkbox in H.
D) Selecting the ‘Z-Score PETH’ (peri event histogram and heatmap) will plot a normalized (robust z-score) heatmap and histogram aligned to the event selected in A. Warmer colors on the heatmap (top) represent higher fluorescent signals at that timepoint, while the line plot on the bottom represents the average for all trials corresponding to the event of interest (D Ex.).
E) The ‘Trial Based Δ F/F PETH’ will plot the absolute Δ F/F values on a peri event heatmap and histogram (E Ex.).
F) Data for individual trials of the Z-Score PETH (D; top) can be exported to a ‘.CSV’ file and saved for plotting or processing elsewhere.
G) Data for the average trace of the Z-Score PETH (D; bottom) can also be exported to a ‘.CSV’ file for plotting or processing elsewhere.
H) The checkbox for H produces two graphs, showing the AUC and Peak values defined by the user in the cells provided in C.
I) The AUC and Peak values can also be exported into a ‘.CSV’ file. These are commonly collated across experimental subjects or groups for statistical analysis.