
Figure 1.
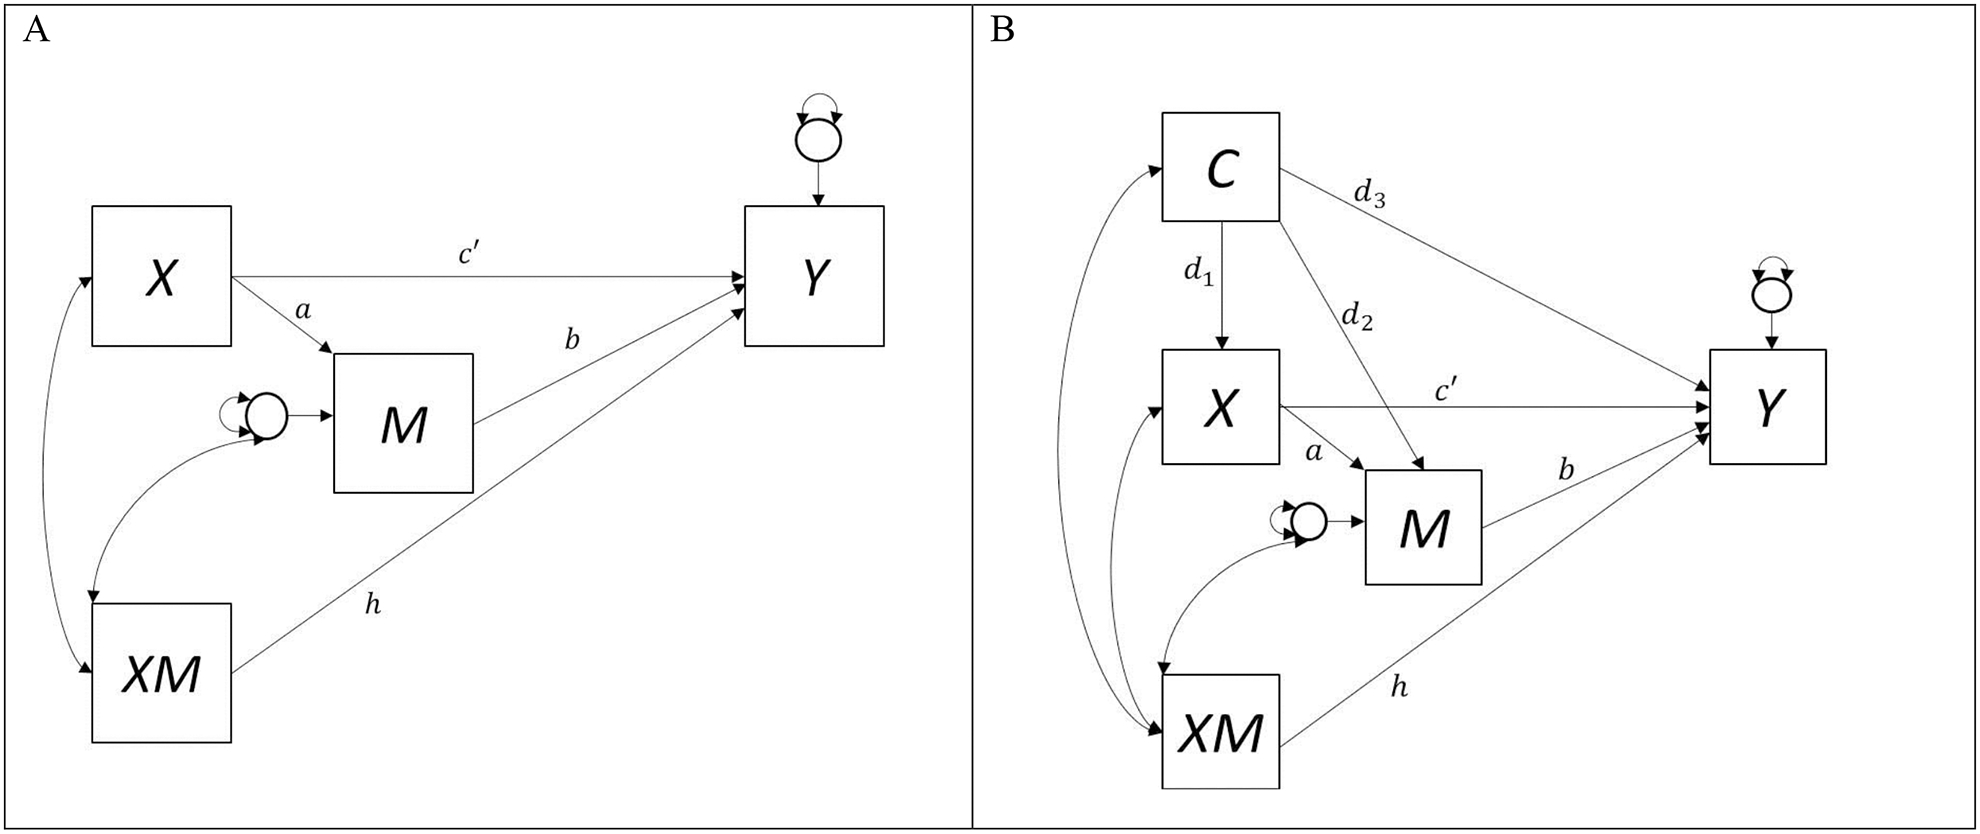
(A) Path diagram depicting the single mediator model with treatment by mediator interaction (XM). (B) Path diagram depicting the single mediator model with treatment by mediator interaction (XM) and baseline covariate (C) confounding the X-M, M-Y, and X-Y relations.