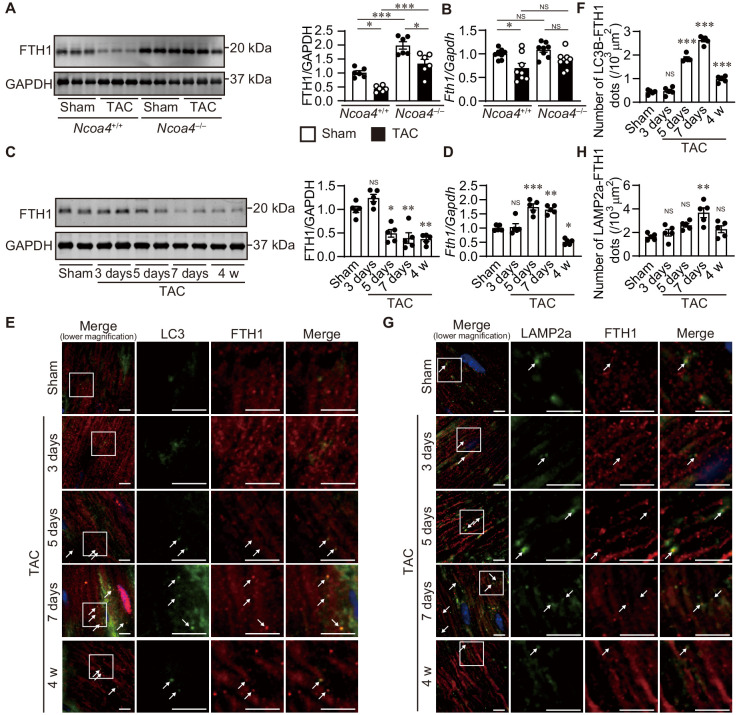
Figure 2. The time course of ferritinophagy in the heart after transverse aortic constriction (TAC).
(A) Western blot analysis of FTH1 in Ncoa4+/+ and Ncoa4–/– hearts 4 weeks after TAC. GAPDH was used as the loading control. The right-hand graphs show the densitometric analysis. The average value for sham-operated Ncoa4+/+ hearts was set to 1 (biologically independent samples: n = 6). (B) mRNA expression of Fth1 in the heart 4 weeks after TAC. Gapdh mRNA was used as the loading control. The average value for sham-operated Ncoa4+/+ hearts was set to 1 (biologically independent samples: n = 8). (C–H) The Ncoa4+/+ mice were subjected to TAC and analyzed 3 days after sham operation and 3, 5, and 7 days and 4 weeks after the operation. (C) Heart homogenates after TAC were subjected to western blot analysis using anti-FTH1 antibody (n = 5 biologically independent samples for each group). GAPDH was used as the loading control. (D) Cardiac Fth1 mRNA levels after TAC (n = 5 biologically independent samples). Gapdh mRNA was used as the loading control. (E and F) Immunofluorescence analysis of LC3B (green) and FTH1 (red) in the heart after TAC (n = 5 biologically independent samples). (G and H) Immunofluorescence analysis of LAMP2a (green) and FTH1 (red) in the heart after TAC (n = 5 biologically independent samples). Scale bar, 5 μm in (E) and (G). Arrows indicate double-positive dots. The values are presented as the mean ± SEM. The data were evaluated by one-way analysis of variance (ANOVA), followed by Tukey–Kramer’s post hoc test. *p<0.05, **p<0.001, ***p<0.0001. NS, p>0.05 versus sham-operated group. Exact p-values are provided in Supplementary file 1.


