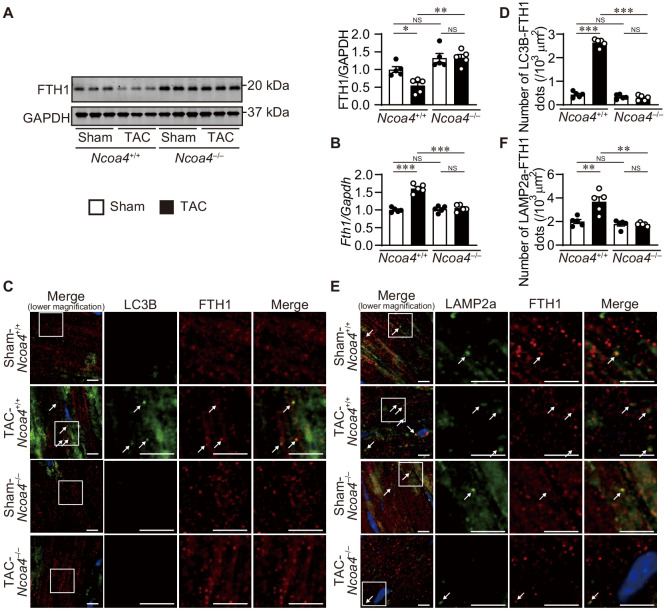
Figure 3. Ablation of Ncoa4 in cardiomyocytes showed defective ferritinophagy.
(A) Western blot analysis of FTH1 in Ncoa4+/+ and Ncoa4–/– hearts 1 week after transverse aortic constriction (TAC). GAPDH was used as the loading control. The right-hand graphs show the densitometric analysis. The average value for sham-operated Ncoa4+/+ hearts was set to 1 (biologically independent samples: n = 5). (B) mRNA expression of Fth1 in the heart 1 week after TAC. Gapdh mRNA was used as the loading control. The average value for sham-operated Ncoa4+/+ hearts was set to 1 (biologically independent samples: n = 5). (C and D) Immunofluorescence analysis of LC3B (green) and FTH1 (red) in the heart 1 week after TAC. The number of LC3B- and FTH1-positive dots is shown in (D). (E and F) Immunofluorescence analysis of LAMP2a (green) and FTH1 (red) in the heart 1 week after TAC. The number of LAPM2a- and FTH1-positive dots is shown in (F). In (C) and (E), images of the square in the merged images are shown at higher magnification in the right three columns. Scale bar, 5 μm. Arrows indicate double-positive dots. The data were evaluated by one-way analysis of variance (ANOVA), followed by Tukey–Kramer’s post hoc test. *p<0.05, **p<0.001, ***p<0.0001. NS, p>0.05. Exact p-values are provided in Supplementary file 1.

