. 2021 Feb 2;10:e62174. doi: 10.7554/eLife.62174

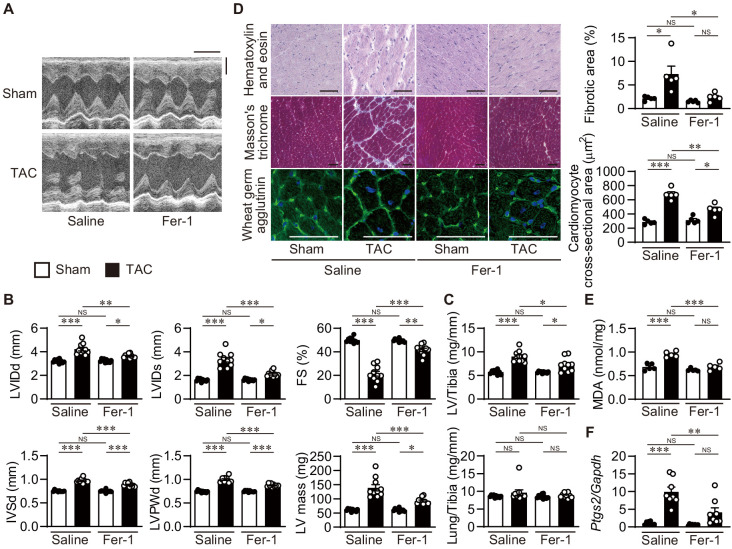
Figure 6. Inhibition of lipid peroxidation protects hearts from pressure overload.

Wild-type C57BL/6J mice were subjected to transverse aortic constriction (TAC) and analyzed 4 weeks after the operation. Ferrostatin-1 (Fer-1) or saline was intraperitoneally administered daily starting 1 day before TAC. (A) Representative images of transthoracic M-mode echocardiographic tracing. Scale bars, 0.1 s and 2 mm, respectively. (B) Echocardiographic parameters of the mice (n = 10 biologically independent samples). (C) Physiological parameters of the mice (n = 10 biologically independent samples). (D) Histological analysis of the heart. Scale bar, 50 μm. The upper and lower right graphs show the ratio of the fibrotic area to whole heart section and the cross-sectional area of cardiomyocytes, respectively (n = 5 biologically independent samples). (E) Cardiac MDA levels (n = 5 biologically independent samples). (F) Ptgs2 mRNA levels in the hearts (n = 8 biologically independent samples). The data were evaluated by one-way analysis of variance (ANOVA) followed by Tukey–Kramer’s post hoc test. *p<0.05, **p<0.001, ***p<0.0001. NS, p>0.05. Exact p-values are provided in Supplementary file 1.

Figure 6—source data 1. Source data for Figure 6.

Figure 6.

Figure 6—figure supplement 1. Cardiac remodeling markers and 4-HNE staining in ferrostatin-1-treated transverse aortic constriction (TAC)-operated wild-type hearts.
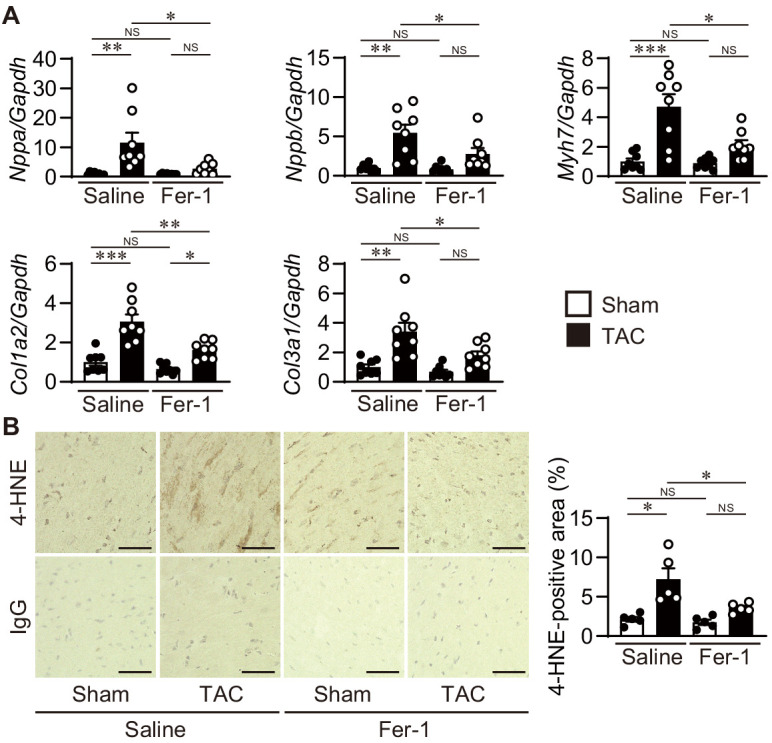
Figure 6—figure supplement 1.

The wild-type C57BL/6J mice were subjected to TAC. Ferrostatin-1 (Fer-1) was intraperitoneally administered daily starting one day before TAC. (A) The levels of mRNA were analyzed 4 weeks after the operation (n = 8 biologically independent samples). Gapdh mRNA was used as the loading control. (B) 4-Hydroxy-2-noneal (4-HNE) staining of heart sections. Scale bar, 50 μm. The right panel shows the quantitative analysis of 4-HNE-positive area (n = 5 biologically independent samples). The values are presented as the mean ± SEM. The data were evaluated by one-way analysis of variance (ANOVA) followed by Tukey–Kramer’s post hoc test. *p<0.05, **p<0.001, ***p<0.0001. NS, p>0.05. Exact p-values are provided in Supplementary file 1.
Figure 6—figure supplement 1—source data 1. Source data for Figure 6—figure supplement 1.
Figure 6—figure supplement 2. Ferrostatin-1 does not provide additional protection from cardiac remodeling in Ncoa4–/– mice.
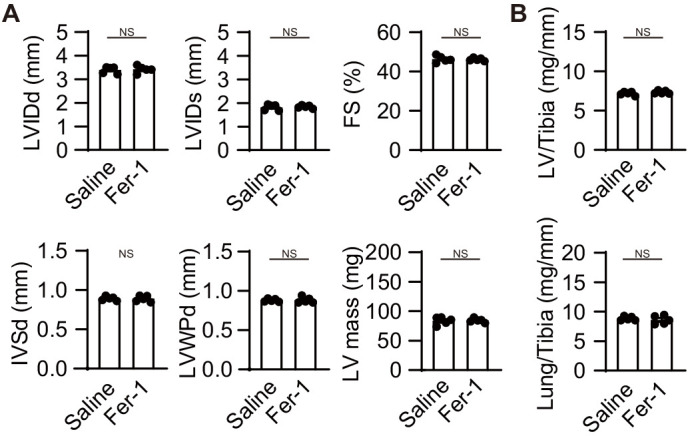
Figure 6—figure supplement 2.

The Ncoa4–/– mice were subjected to TAC. Ferrostatin-1 (Fer-1) or saline was intraperitoneally administered daily starting one day before TAC. (A) Echocardiographic parameters of the mice (n = 5 biologically independent samples). LVIDd and LVIDs, end-diastolic and end-systolic left ventricular (LV) internal dimensions; IVSd, end-diastolic interventricular septum thickness; LVPWd, end-diastolic LV posterior wall thickness; FS, fractional shortening. (B) Physiological parameters of the mice (n = 5 biologically independent samples). The values are presented as the mean ± SEM. The data were evaluated by unpaired, two-tailed Student’s t-test. NS, p>0.05. Exact P p-values are provided in Supplementary file 1.
Figure 6—figure supplement 2—source data 1. Source data for Figure 6—figure supplement 2.