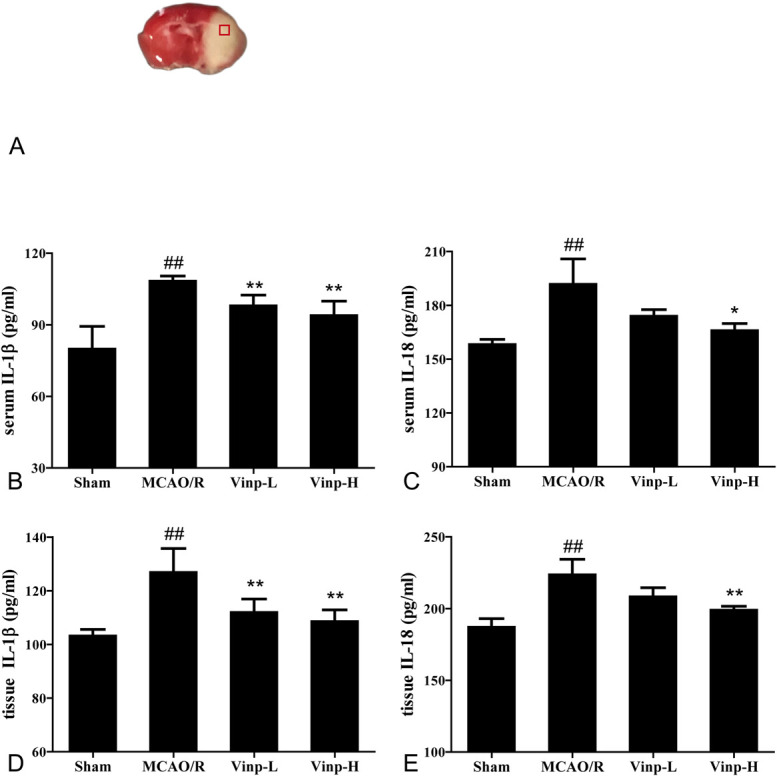
FIGURE 2.

Effect of Vinp on the expressions of IL-1β and IL-18 in serum and ischemic brain at 24 hours after MCAO/R. A, Coronal brain diagrams showing locations of regions for molecular analysis in infarct cortex. The level of serum IL-1β (B), IL-18 (C), cerebral homogenate IL-1β (D), and IL-18 (E) at 24 hours after MCAO/R (n = 6). Values are shown as mean ± SD. #P < 0.05, ##P < 0.01, versus sham group; *P < 0.05, **P < 0.01, versus MCAO/R group.
