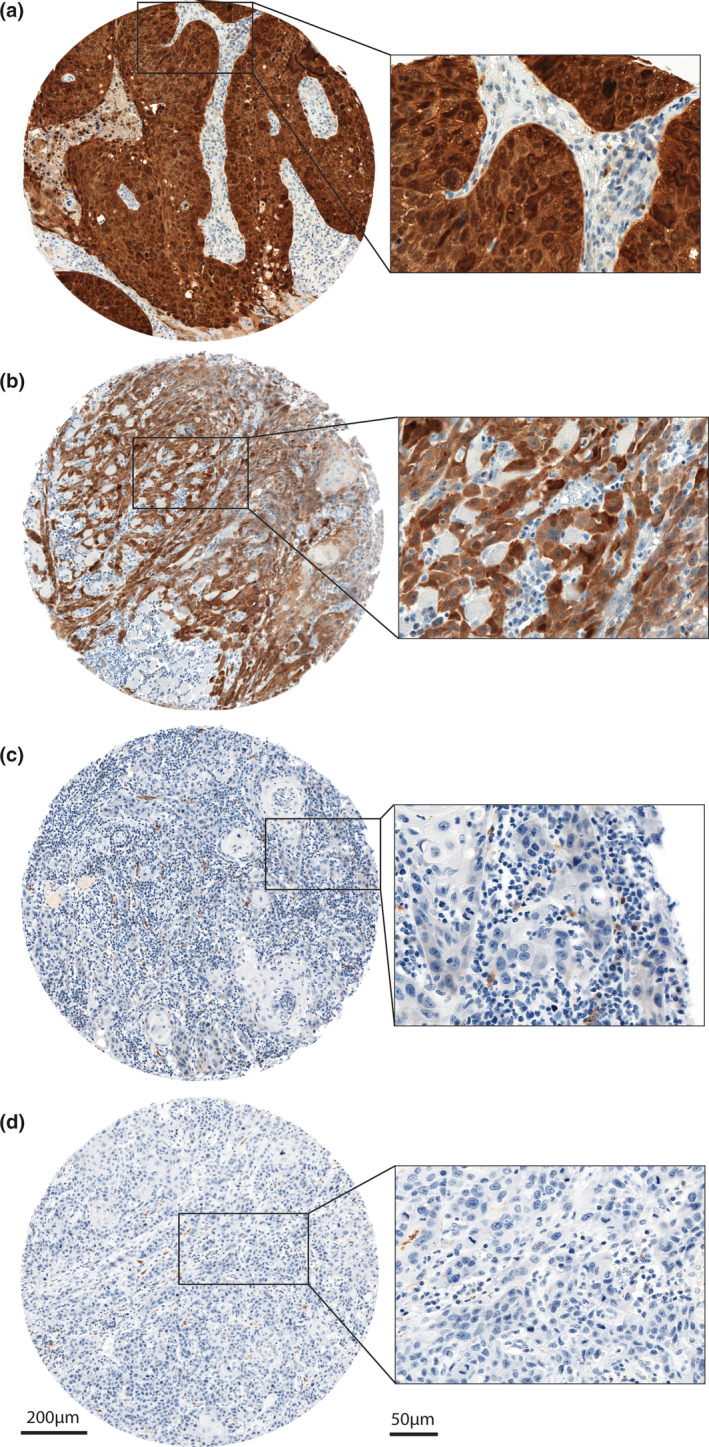
FIGURE 2.

p16 immunohistochemistry in OTSCC. 2A = Strong and uniform p16‐staining (both cytoplasmic and nuclear) in >70% of OTSCC cells, score 3. 2B = cytoplasmic p16 staining in >70% of the OTSCC cells, score 2. 2C = weak cytoplasmic staining in OTSCC cells, score 1. 2D = p16 negative OTSCC cells, score 0
