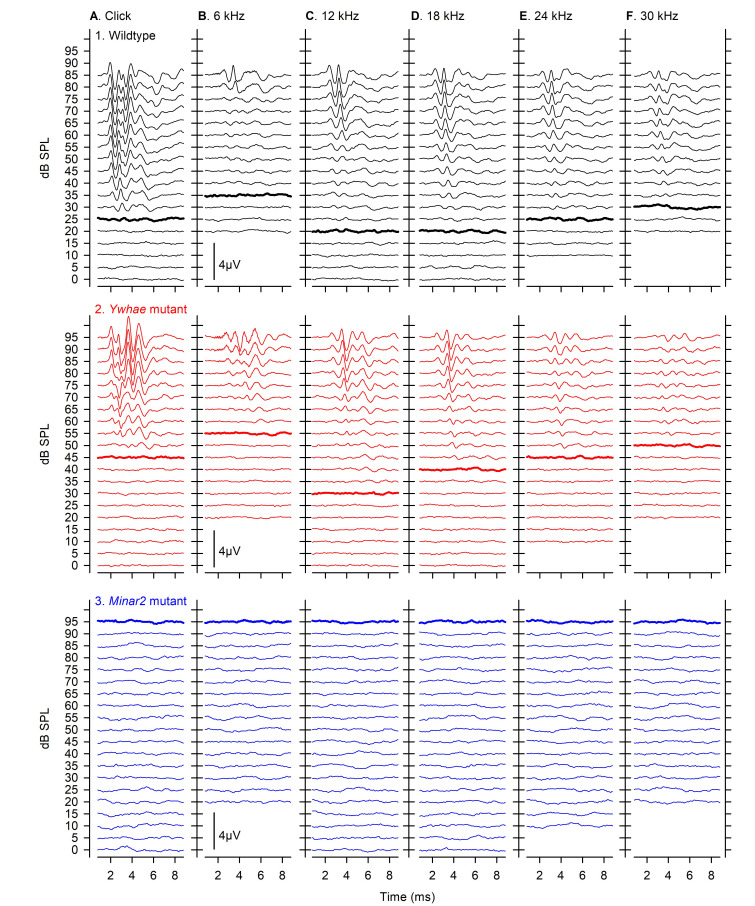
Figure 2. Example ABR responses from wildtype and mutant mice.
ABRs are plotted stacked for increasing stimulus dB Sound Pressure Level (SPL), from 0 to 95 dB. Responses in A were evoked by clicks, and those in B-F were evoked by tone pips of 6, 12, 18, 24 and 30 kHz. The threshold sensitivity of each response set, determined by visual inspection of the responses by an experienced experimenter, are indicated by a thickened line on each panel. Typical responses obtained from a wildtype mouse with normal hearing sensitivity are shown in row 1 (black). Responses from a Ywhae homozygous mutant mouse with mild-moderate elevations in hearing sensitivity are shown in row 2 (red). Recordings from a Minar2 homozygous mutant mouse where no visible responses were measured up to 95 dB are shown in row 3 (blue). In such cases, threshold was allocated as the highest dB SPL tested, to allow plotting of data and comparison with other mice. These data have been published previously in Ingham et al. (2019) .

