
Figure 5. Representative RPA-SIRF image in HAP-1 cells.
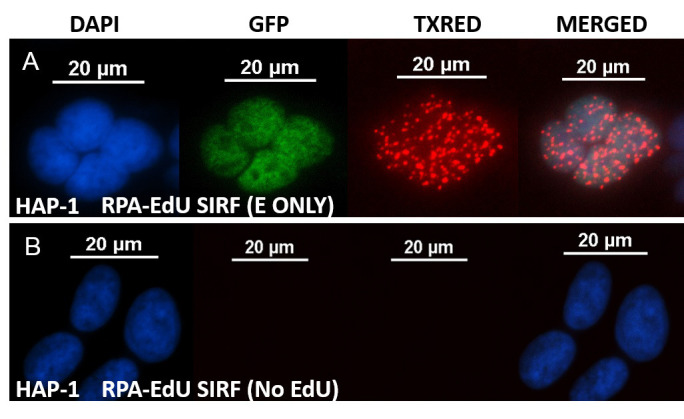
A. representative images of an RPA-SIRF assay in HAP-1 cells that have been treated with 125 μM EdU for 8 min. The cells were co-clicked with biotin-azide and alexa 488-azide (10:1, total 10 μM). The GFP channel shows the EdU-Alexa 488 signal of S-phase cells. PLA signals are visualized in TXRED channel. The PLA signal can be normalized to the Alexa 488 signal to account for PLA signal differences depending on EdU content of the cells. B. representative images of RPA-SIRF with no EdU condition (negative control). scale bars = 20 μm.