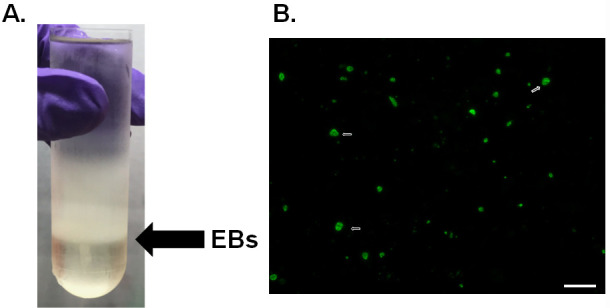
Figure 2. Density gradient purification of EBs.

A. Gradient purification of C.t. L2. Black arrow denotes the location of EBs at the 54% and 44% interface. B. Immunofluorescence of chlamydia titer plates. C.t. was stained using anti-LPS (green) and the white arrow denotes examples of the chlamydia inclusions. Scale bar is 50 µm.
