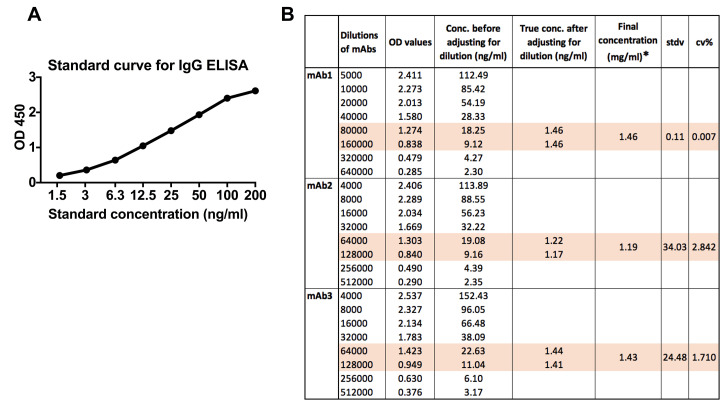
Figure 6. Example of IgG ELISA data.
A. Standard curve for the IgG ELISA. B. Table showing absorbance data and calculation of IgG concentration. Briefly, a linear line is fitted to the standard curve and used to extrapolate concentration values from the absorbances for the different diluted samples. Only absorbance within the linear range of the standard curve are will give an accurate calculation (here highlighted in orange). The final concentration of the IgG stock is calculated by multiplication with the dilution factor. Calculation can be made manually or by using the ELISA reader software. *. The true conc. values represent the average concentration of the two values of the conc. before adjusting for dilution.

