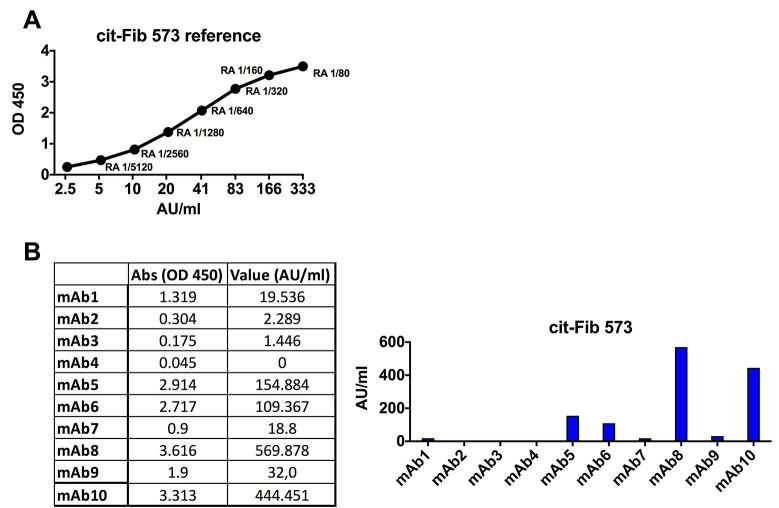
Figure 11. Example of anti cit-Fib 573 (aa563-583) ELISA data.
A. Standard curve for the cit-Fib 573 ELISA using a positive RA reference serum [here dilution 1:80 is set to 333 Activity Units (AU)/ml]. B. Data showing ACPA-positive (blue bars) and negative mAbs for cit-Fib 573 ELISA at 5 μg/ml IgG. Qualification of the mAb reactivity for comparison between ELISA runs can be made by fitting a linear line to the standard curve and extrapolating a relative reactivity in AU/ml from the absorbance values.

