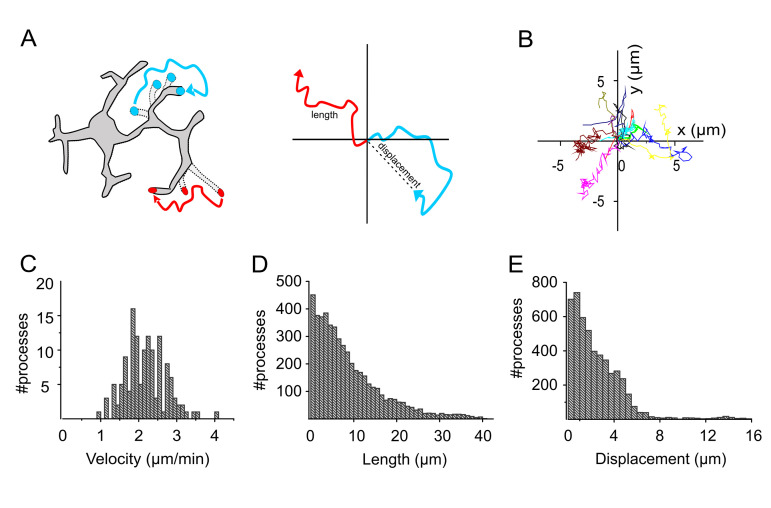
Figure 4. Analysis of microglia movement in Cx3cr1+/GFP mice.
A. Schematic showing the length and displacement of a moving process. B. Representative images of trajectory plots, plotted starting at the center. C-E. Plots representing the distribution of velocity (C), length (D) and displacement (E) of the individual tracks shown in B (adapted from Basilico et al., 2019 ).

