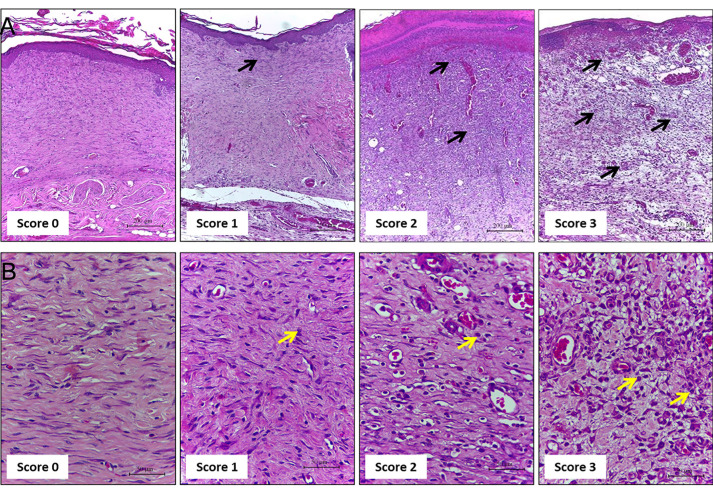
Figure 4. Representative photomicrographs of sections stained with H & E showing the inflammation score.
Score 0: skin; Score 1: the wound of Days 21 and 14; Score 2: on Day 7, score 3: on Day 3. Inflammatory cells indicated by black and yellow arrows at different concentrations according to the healing time. A. Scale bars: 200 μm B. Scale bars: 50 μm.

