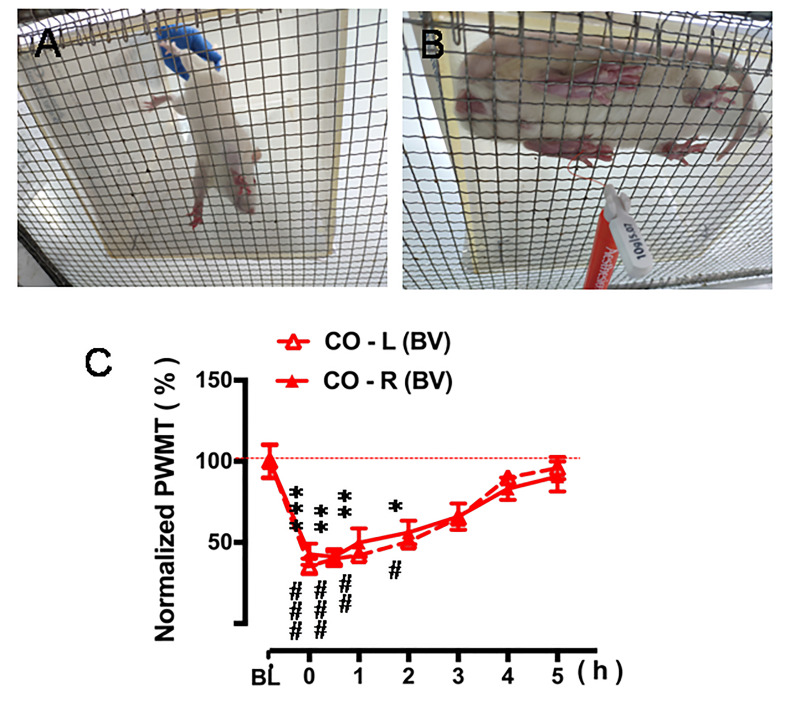
Figure 4. Quantitative measurement of pain sensitivity after PDSI.
A. Place the CO rat on the metal mesh platform lightly and avoid fright. B. Measure the changes in PWMT after 30-min PDSI with a CD in pain every hour interval. C. Five-hour time courses of decrease in bilateral PWMT after 30-min PDSI when compared to the value of baseline (BL) PWMT (Figure 4C from Li et al., 2018 . Validating rat model of empathy for pain: effects of pain expressions in social partners. Front Behav Neurosci, 12:242. With permission according to CC BY license of open access journals).

