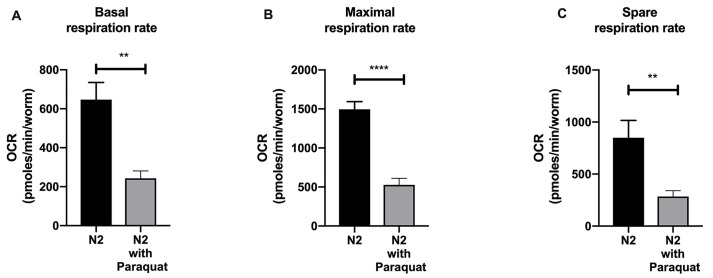
Figure 6. Bar graph comparing basal (A), maximal (B) and spare respiration (C) of wild type N2 and N2 treated with 10 mM Paraquat after our normalization workflow and post-experimental analysis.
Data were plotted as means ± SEM, analyzed using Student’s t-test. In the figures, P values ≤ 0.01 are summarized as two asterisks, P values ≤ 0.0001 are summarized as four asterisks.

