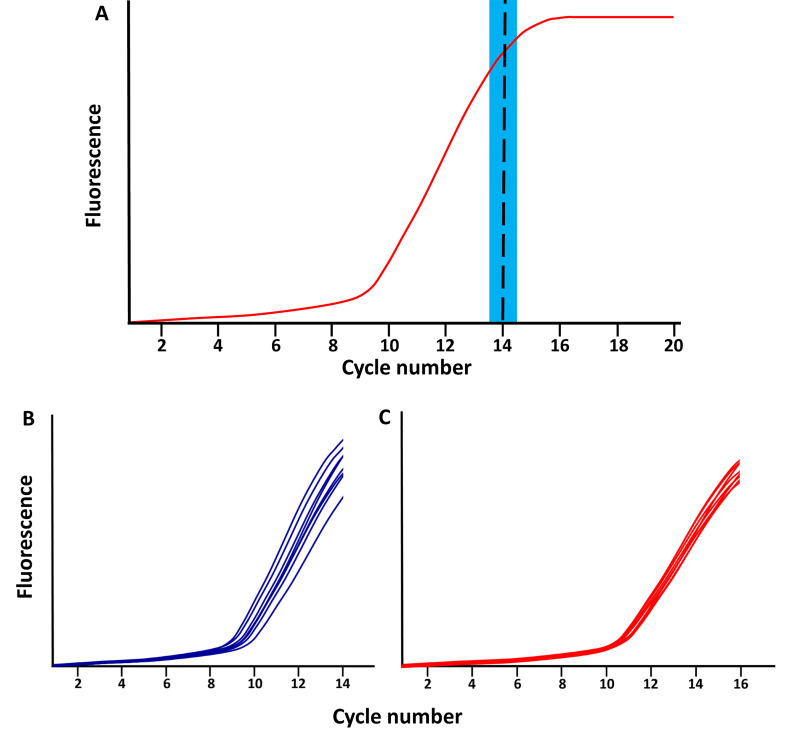
Figure 2. Schematic of qPCR library amplification plots.
A. The red line represents the total amplified product accumulation at each qPCR cycle. The blue rectangle represents the period when the qPCR library amplification should be stopped; following the exponential phase and just before the plateau phase. B-C. Examples of library amplifications for 2 sample (each separated in 8 wells) stopped at (B) cycle 14 and (C) cycle 16.

