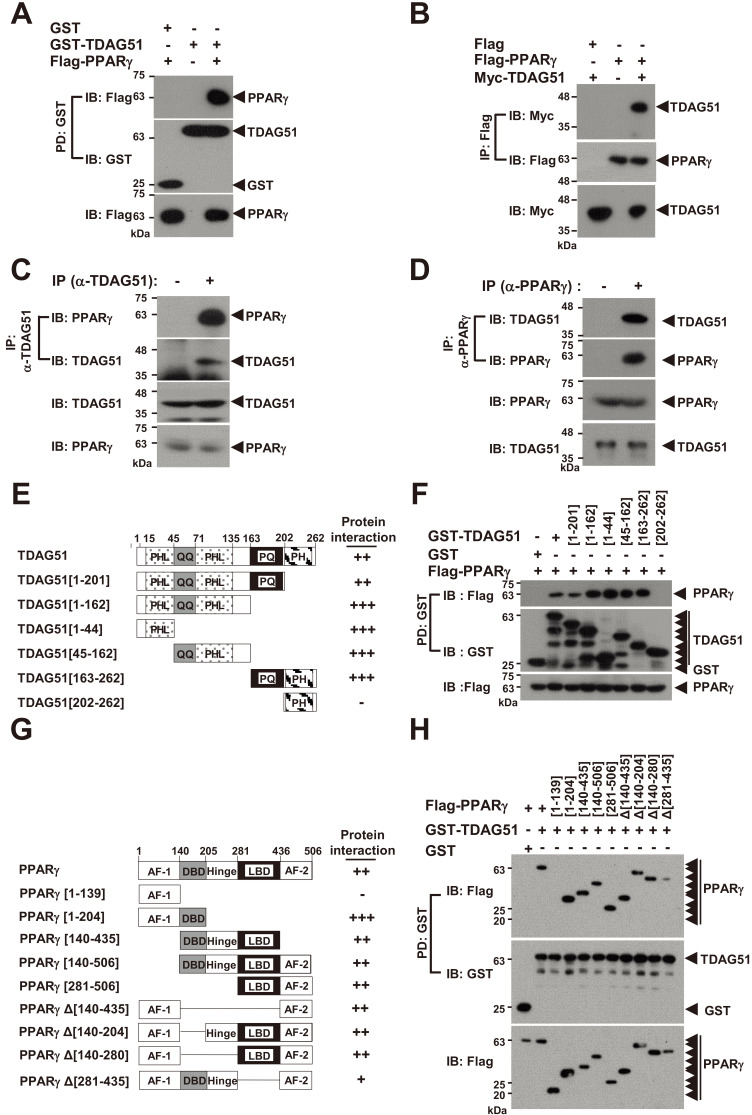
Fig. 2. TDAG51 interacts with PPARγ.
(A) TDAG51 binds to PPARγ. 293T cells were transfected with GST-TDAG51 (1.5 µg) with or without Flag-PPARγ (2.5 µg). GST-TDAG51 was pulled down (PD) using GST beads. The bound proteins were visualized via anti-Flag (top) or anti-GST (middle) immunoblotting (IB). The level of PPARγ expression in whole cell lysates was detected via anti-Flag IB (bottom). GST alone (mock) was used as a control. Protein expression is indicated by an arrow. (B) PPARγ binds to TDAG51. 293T cells were transfected with Flag-PPARγ (1.5 µg) with or without Myc-TDAG51 (2.5 µg). The bound proteins by anti-Flag IP were visualized via anti-Myc (top) or anti-Flag IB (middle). The level of TDAG51 expression in whole cell lysates was detected via anti-Myc IB (bottom). Flag alone (mock) was used as a control. (C) Identification of the endogenous TDAG51-PPARγ interaction. Endogenous TDAG51 was immunoprecipitated (IP) with an anti-(α-)TDAG51 antibody and visualized via anti-TDAG51 IB (second). Proteins bound to TDAG51 were visualized via anti-PPARγ IB (top). The levels of endogenous TDAG51 and PPARγ in whole cell lysates were detected via anti-TDAG51 (third) and anti-PPARγ IB (bottom), respectively. (D) Identification of the endogenous PPARγ-TDAG51 interaction. Endogenous PPARγ was immunoprecipitated with an anti-(α-)PPARγ antibody and visualized via anti-PPARγ IB (second). Proteins bound to PPARγ were visualized via anti-TDAG51 IB (top). The levels of endogenous PPARγ and TDAG51 in whole cell lysates were detected via anti-PPARγ (third) and anti-TDAG51 IB (bottom), respectively. (E) Schematic diagram of TDAG51 mutants. PHL, pleckstrin homology-like domain; QQ, glutamine repeat; PQ, proline-glutamine repeat; PH, proline-histidine repeat. The number of amino acid residues is shown. The interactions of deletion mutants are summarized at the right panel. (F) Analysis of TDAG51 deletion mutants interacting with PPARγ. The bound proteins by GST-PD were visualized via anti-Flag (top) or anti-GST IB (middle). The level of PPARγ expression in whole cell lysates was detected via anti-Flag IB (bottom). (G) Schematic diagram of PPARγ mutants. AF-1, activation function-1 domain; DBD, DNA binding domain; Hinge, hinge domain; AF-2, activation function-2 domain; LBD, ligand binding domain. The interactions of deletion mutants are summarized at the right panel. (H) Analysis of PPARγ deletion mutants interacting with TDAG51. The bound proteins by GST-PD were visualized via anti-Flag (top) or anti-GST IB (middle). The PPARγ expression level in whole cell lysates was detected via anti-Flag IB (bottom).

