
Figure 6. Oxygen measurements in the pericellular media using the PreSens Oxygen Microsensor (graphed on GraphPad Prism).
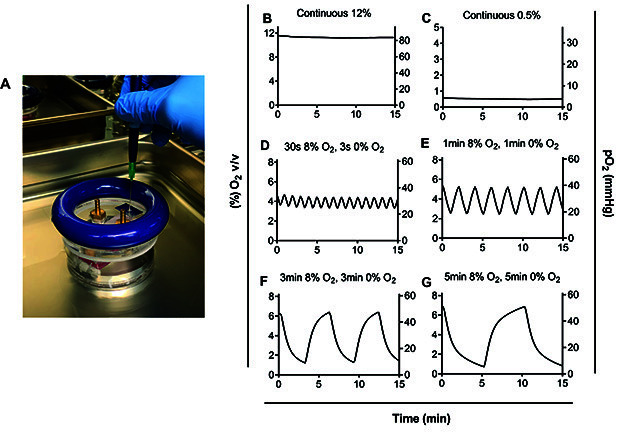
A. Insertion of the needle of the oxygen probe through the hole in the lid of the hypoxic chamber. B. Exposure to 12% O2 continuously, C. Exposure to 0.5% O2 continuously, D. Exposure to 30 s of 8% O2 followed by 30 s of 0% O2, E. Exposure to 1 min of 8% O2 followed by 1 min of 0% O2, E. Exposure to 3 min of 8% O2 followed by 3 min of 0% O2, and G. Exposure to 5 min of 8% O2 followed by 5 min of 0% O2. D-G. Time in each condition needed to be extended to 5 min in order for pericellular levels to reach the desired oxygen tension of 50 mmHg at the peak of cycles and 5 mmHg at the nadir or trough of cycles. Different oxygen concentrations can be modeled (see [ Minoves et al., 2017 ]) depending on oxygen requirements for the tissue of interest.