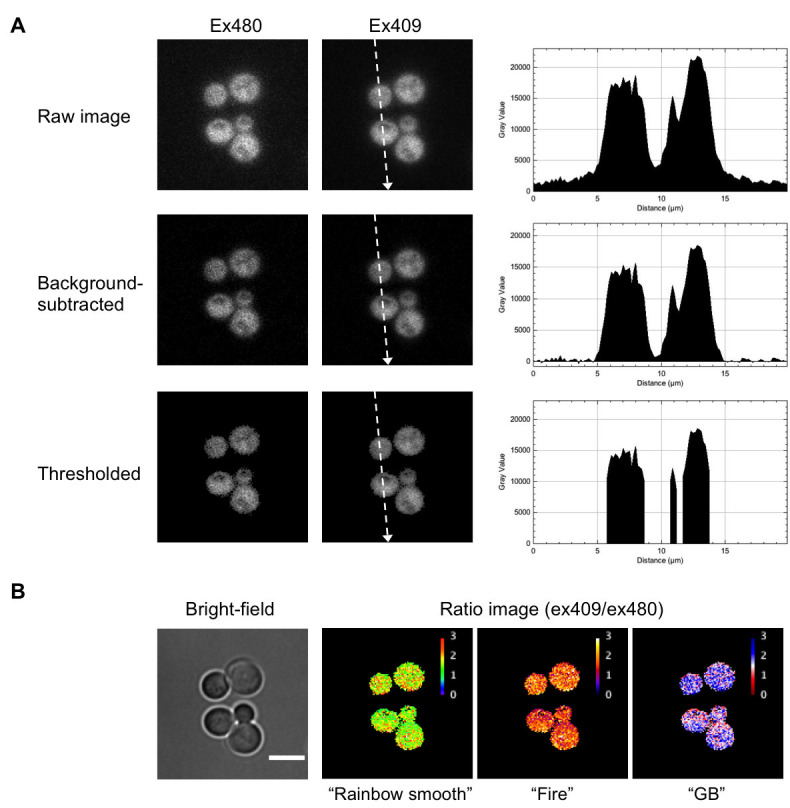
Figure 1. Generation of a QUEEN ratio image.

A. Image processing of images of budding yeast cells expressing QUEEN. Right panels show the line profile of pixel values along dotted lines indicated in the ex409 images. B The bright-field image and QUEEN ratio images calculated from the ex480 and ex409 images shown in (A) expressed in three different lookup tables. White scale bar = 5 µm.
