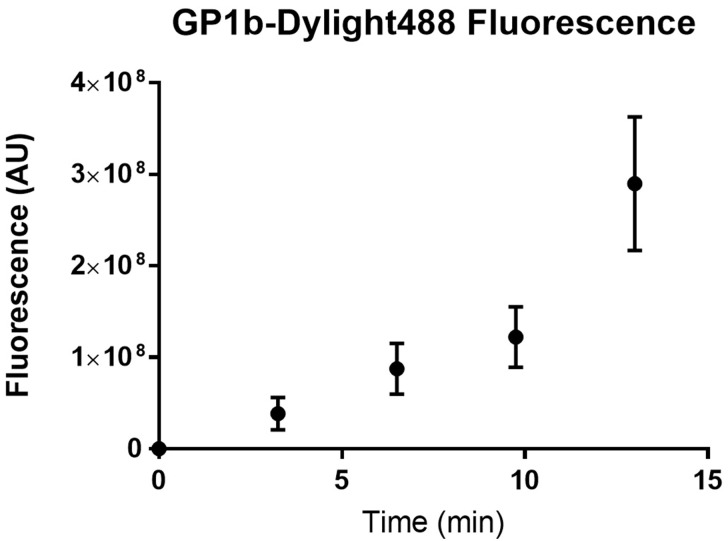
Figure 22. Fluorescence of platelets adhered to a fibrinogen channel over time.
Wild type C57BL/6 mouse platelets were washed and flowed across PDMS biochips coated with fibrinogen 40 μg/ml at a shear rate of 500 s-1. The sum of platelet fluorescence in the field of view was determined every 3 min. The sum of platelet fluorescence was plotted against time using GraphPad prism. Dots represent the mean sum of fluorescence at the specific time point and the error bars represent the standard error of mean from n = 3 experiments.

