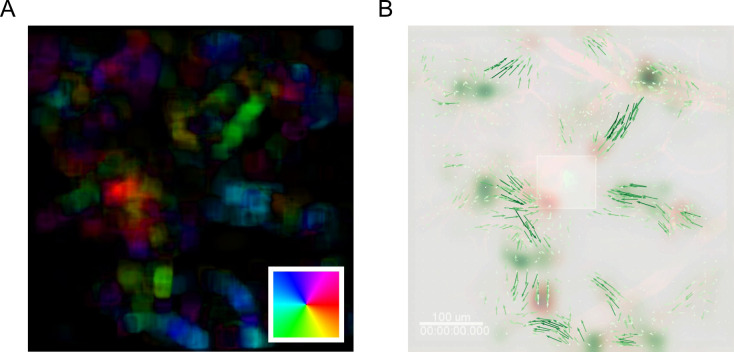
Figure 18. MOSES analysis unbiasedly uncovers the migration of GFP+ neutrophil cells to site of laser injury.
A. Mean motion field after averaging over all time points. Direction of motion is colored according to the inset color wheel. Colour intensity represents the magnitude of the velocity. B. Overlay of the mean superpixel track velocities represented as green arrows plotted on top of the first video frame. Additionally, the computed forward and backward motion saliency maps are shown as red and green heatmaps revealing local motion sinks and sources respectively. Square box in the middle indicates the induced laser injury site.

