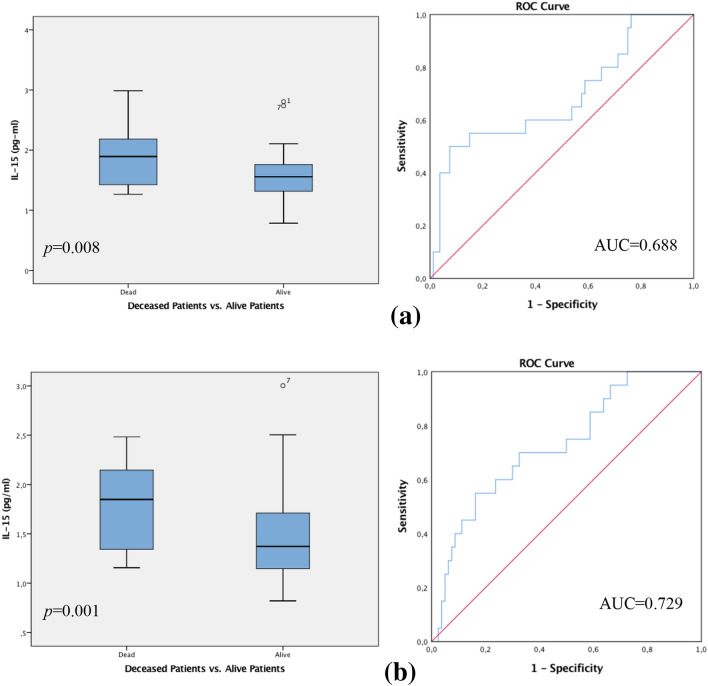
Fig. 1.
a Box plot analysis of Interleukin 15 expression (IL-15) in the sera of patients with CTC-negative breast cancer. IL-15 release was significantly higher in patients who died compared to patients who were living at follow-up (p = 0.008). Receiver operator curve analysis of sensitivity versus specificity gave an area under the curve (AUC) of 0.688 (a). b Box plot analysis of IL-15 expression and patients with CTC-positive disease. IL-15 release was expressively higher in the patient collective who died in the follow-up period compared to the living patient group (p = 0.001). Receiver operator curve analysis of sensitivity versus specificity gave an AUC of 0.729. The range amongst the 25th and 75th percentiles is demonstrated by boxes with a horizontal line at the median. The bars display the 5th and 95th percentiles. Circles specify values more than 1.5 box lengths. Asterisks specify values (marked with a number) more than 3.0 box lengths from the 75th percentile

