Figure 1.
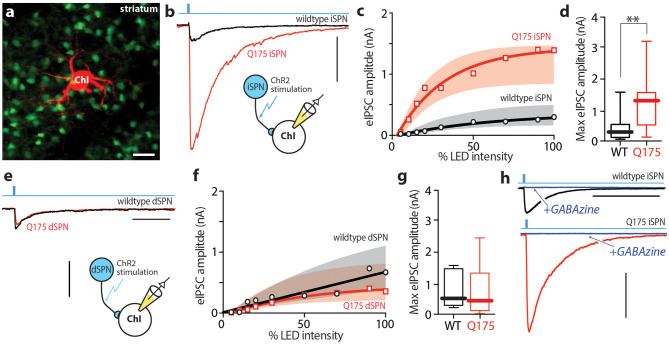
iSPN derived GABAergic signaling onto ChIs is enhanced in 6–9 month old zQ175+/− HD mice. (a) Confocal image showing the giant cholinergic interneuron (red) and several iSPNs in the dorsolateral striatum. (b) Sample traces taken from WT (black) and zQ175+/− (red) ChIs after inducing optogenetic release of GABA from iSPNs. Scale bar = 0.5 nA. (c) Summary of input - output relationship of eIPSC amplitude at the iSPN-ChI synapse at progressively higher optical stimulation intensities. (d) Box plots of peak eIPSC amplitude at the iSPN-ChI synapse at maximum stimulation intensity. (e) Sample traces taken from WT (black) and zQ175+/− (red) ChIs after inducing optogenetic release of GABA from dSPNs. Scale bar = 0.5 nA; 100 ms. (f) Summary of input - output relationship at the dSPN-ChI synapse. (g) Box plots of peak eIPSC amplitude at the dSPN-ChI synapse at maximum stimulation intensity. (h) Addition of SR95531 hydrobromide (GABAzine; blue) completely blocks optogenetic response at the iSPN-ChI synapse in both WT and zQ175+/− mice. Scale bar = 0.5 nA; 500 ms. **P < 0.01.

