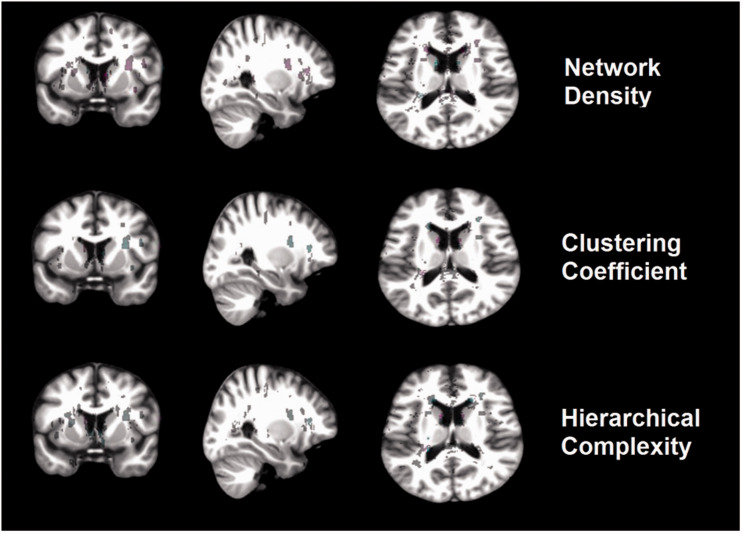
Figure 4.
Illustration of the voxel-based associations between WMH and each of the network measures in a representative slice of each plane. The positive (magenta) and negative (cyan) associations are shown mapped on the study template. The colour intensity is proportional to the strength of the association (normalised to values between 0–256 for visual representation).

