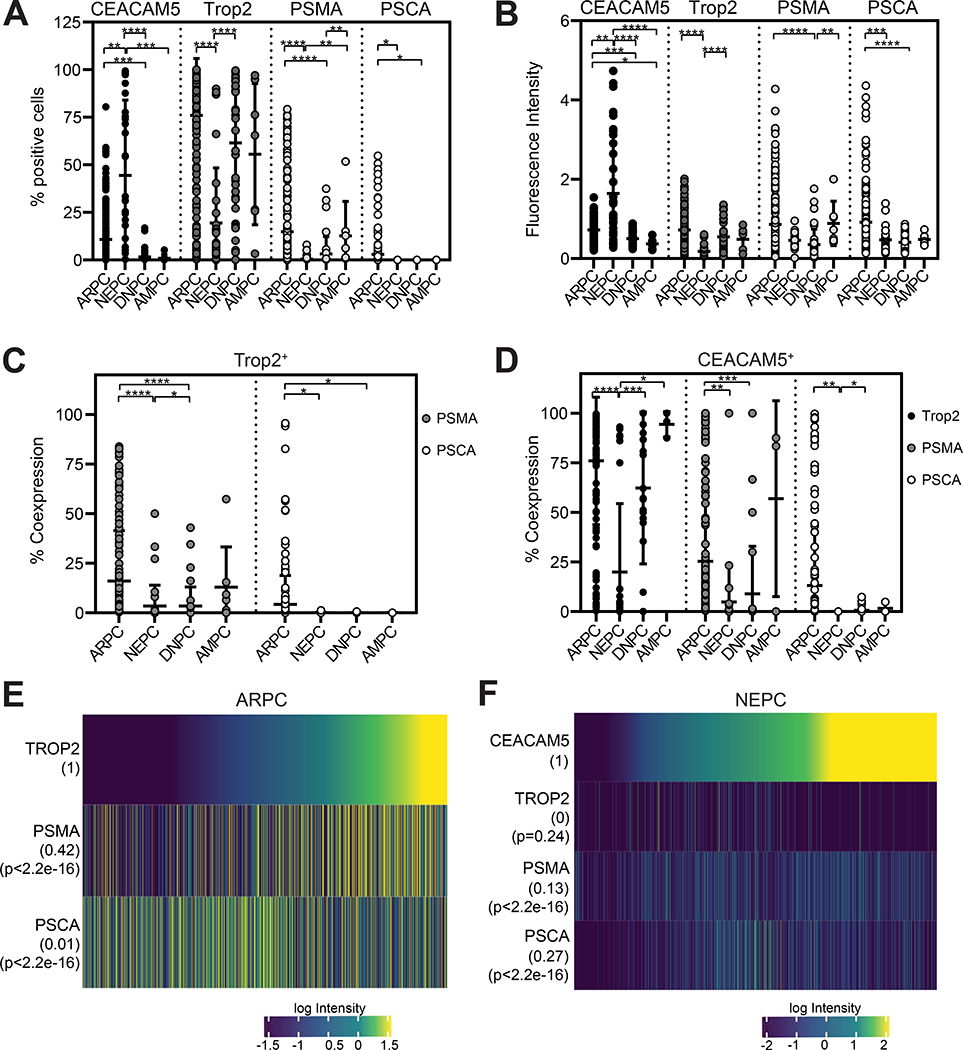
Figure 2. CEACAM5 expression relative to other targetable prostate cancer cell surface antigens.
(A) Percentage of cells expressing CEACAM5, Trop2, PSMA, and PSCA, and (B) staining intensity from mIF of ARPC (n=70), NEPC (n=20), DNPC (n=14), and AMPC (n=3) tissue cores. (C) Co-expression of PSMA and PSCA in Trop2+ cells per core. (D) Co-expression of Trop2, PSMA, and PSCA in CEACAM5+ cells per core. (E) Quantitative single-cell mIF signal intensities of proteins (rows) in cells from ARPC (n=655,676) and (F) NEPC cores (n=113,509). Error bars represent ± SD. * p<0.05; ** p<0.01; *** p<0.001; **** p<0.0001. Kruskal-Wallis p values are shown for plots A-D. Pearson correlation coefficient (r) and P values for each measured protein is shown numerically next to heatmap rows.

