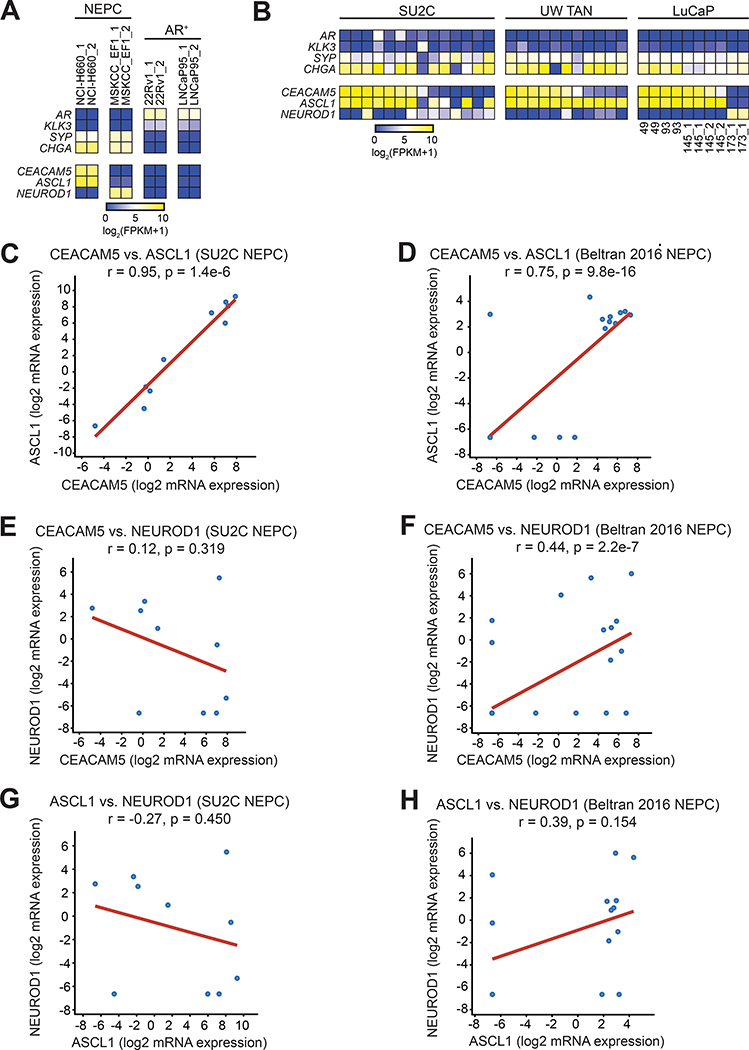
Figure 3. Association of ASCL1 and CEACAM5 expression in NEPC.
(A) RNA-seq gene expression heatmap of ASCL1 and NEUROD1 in NCI-H660, MSKCC EF1, 22Rv1, and LNCaP95 cell lines. (B) RNA-seq gene expression heatmap of NEPC samples (columns) from the Stand Up To Cancer (SU2C) mCRPC cohort, the University of Washington Tissue Acquisition Necropsy (UW TAN) lethal mCRPC cohort, and LuCaP patient-derived xenograft lines. (C-D) Correlation dot plots of CEACAM5 and ASCL1, (E-F) CEACAM5 and NEUROD1, and (G-H) ASCL1 and NEUROD1 gene expression in NEPC samples defined by a neuroendocrine gene signature score >0.4 in the SU2C dataset (n=10) and the Beltran 2016 NEPC dataset (n=15). Pearson correlation coefficients (r) are shown for correlative gene expression analyses.

