
Figure 2. Consensus clustering identifies two distinct ACC subtypes.
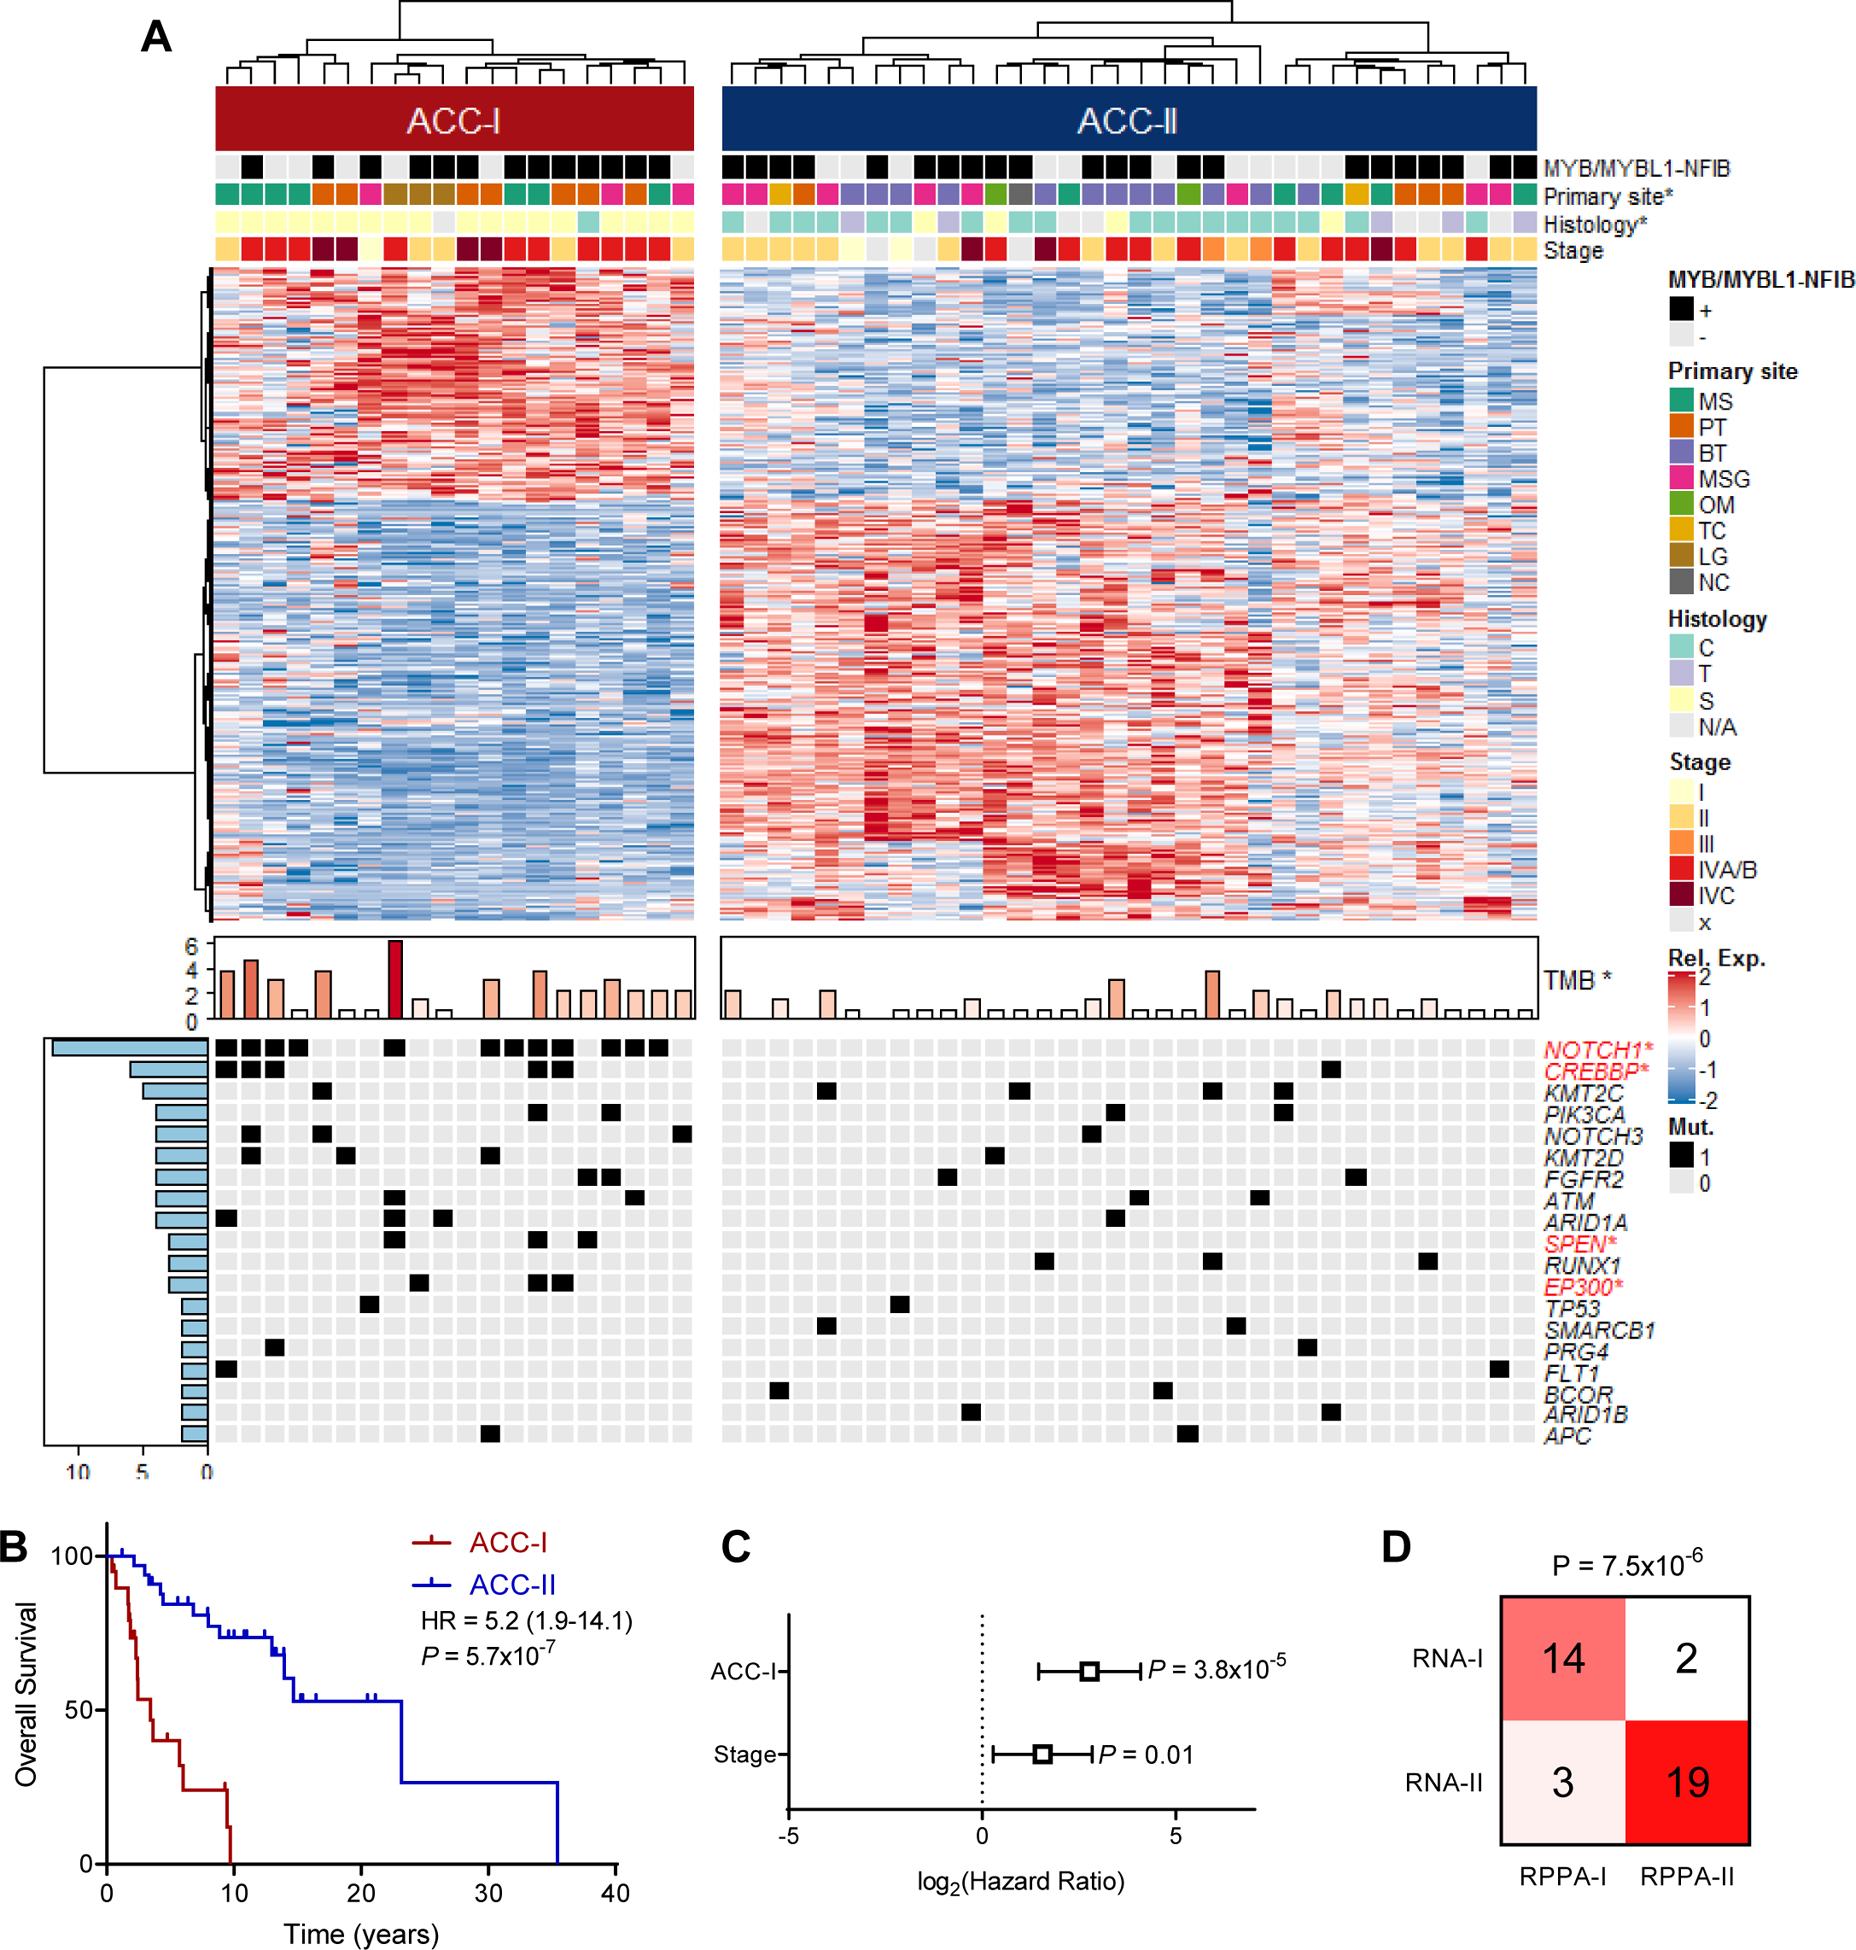
(A) Heatmap of differentially expressed (FDR<0.05, log2(FC)>0.75) genes between two ACC subtypes identified by consensus clustering with MYB/MYBL1-NFIB fusion status determined by FISH, primary site, tumor histology, and stage indicated on top and tumor mutation burden (TMB), as well as all mutations that occur in 2 or more patients indicated on bottom. Legend included to right of heatmap. *p<0.05. See Figure S2A. S: solid, C: cribriform, T: tubular, MS: maxillary sinus, PT: palate, BT: base of tongue, MSG: major salivary gland, OM: other minor salivary gland, TC: trachea, LG: lacrimal gland, NC: nasal cavity.
(B) Overall survival stratified by ACC subtype. Log-rank test.
(C) Multivariate Cox proportional hazards model for overall survival based on both subtype and tumor stage.
(D) Concordance between ACC subtypes based on gene expression (RNA) and targeted proteomics (RPPA). Fisher’s exact test.