
Figure 3. Gene expression alterations between ACC subtypes.
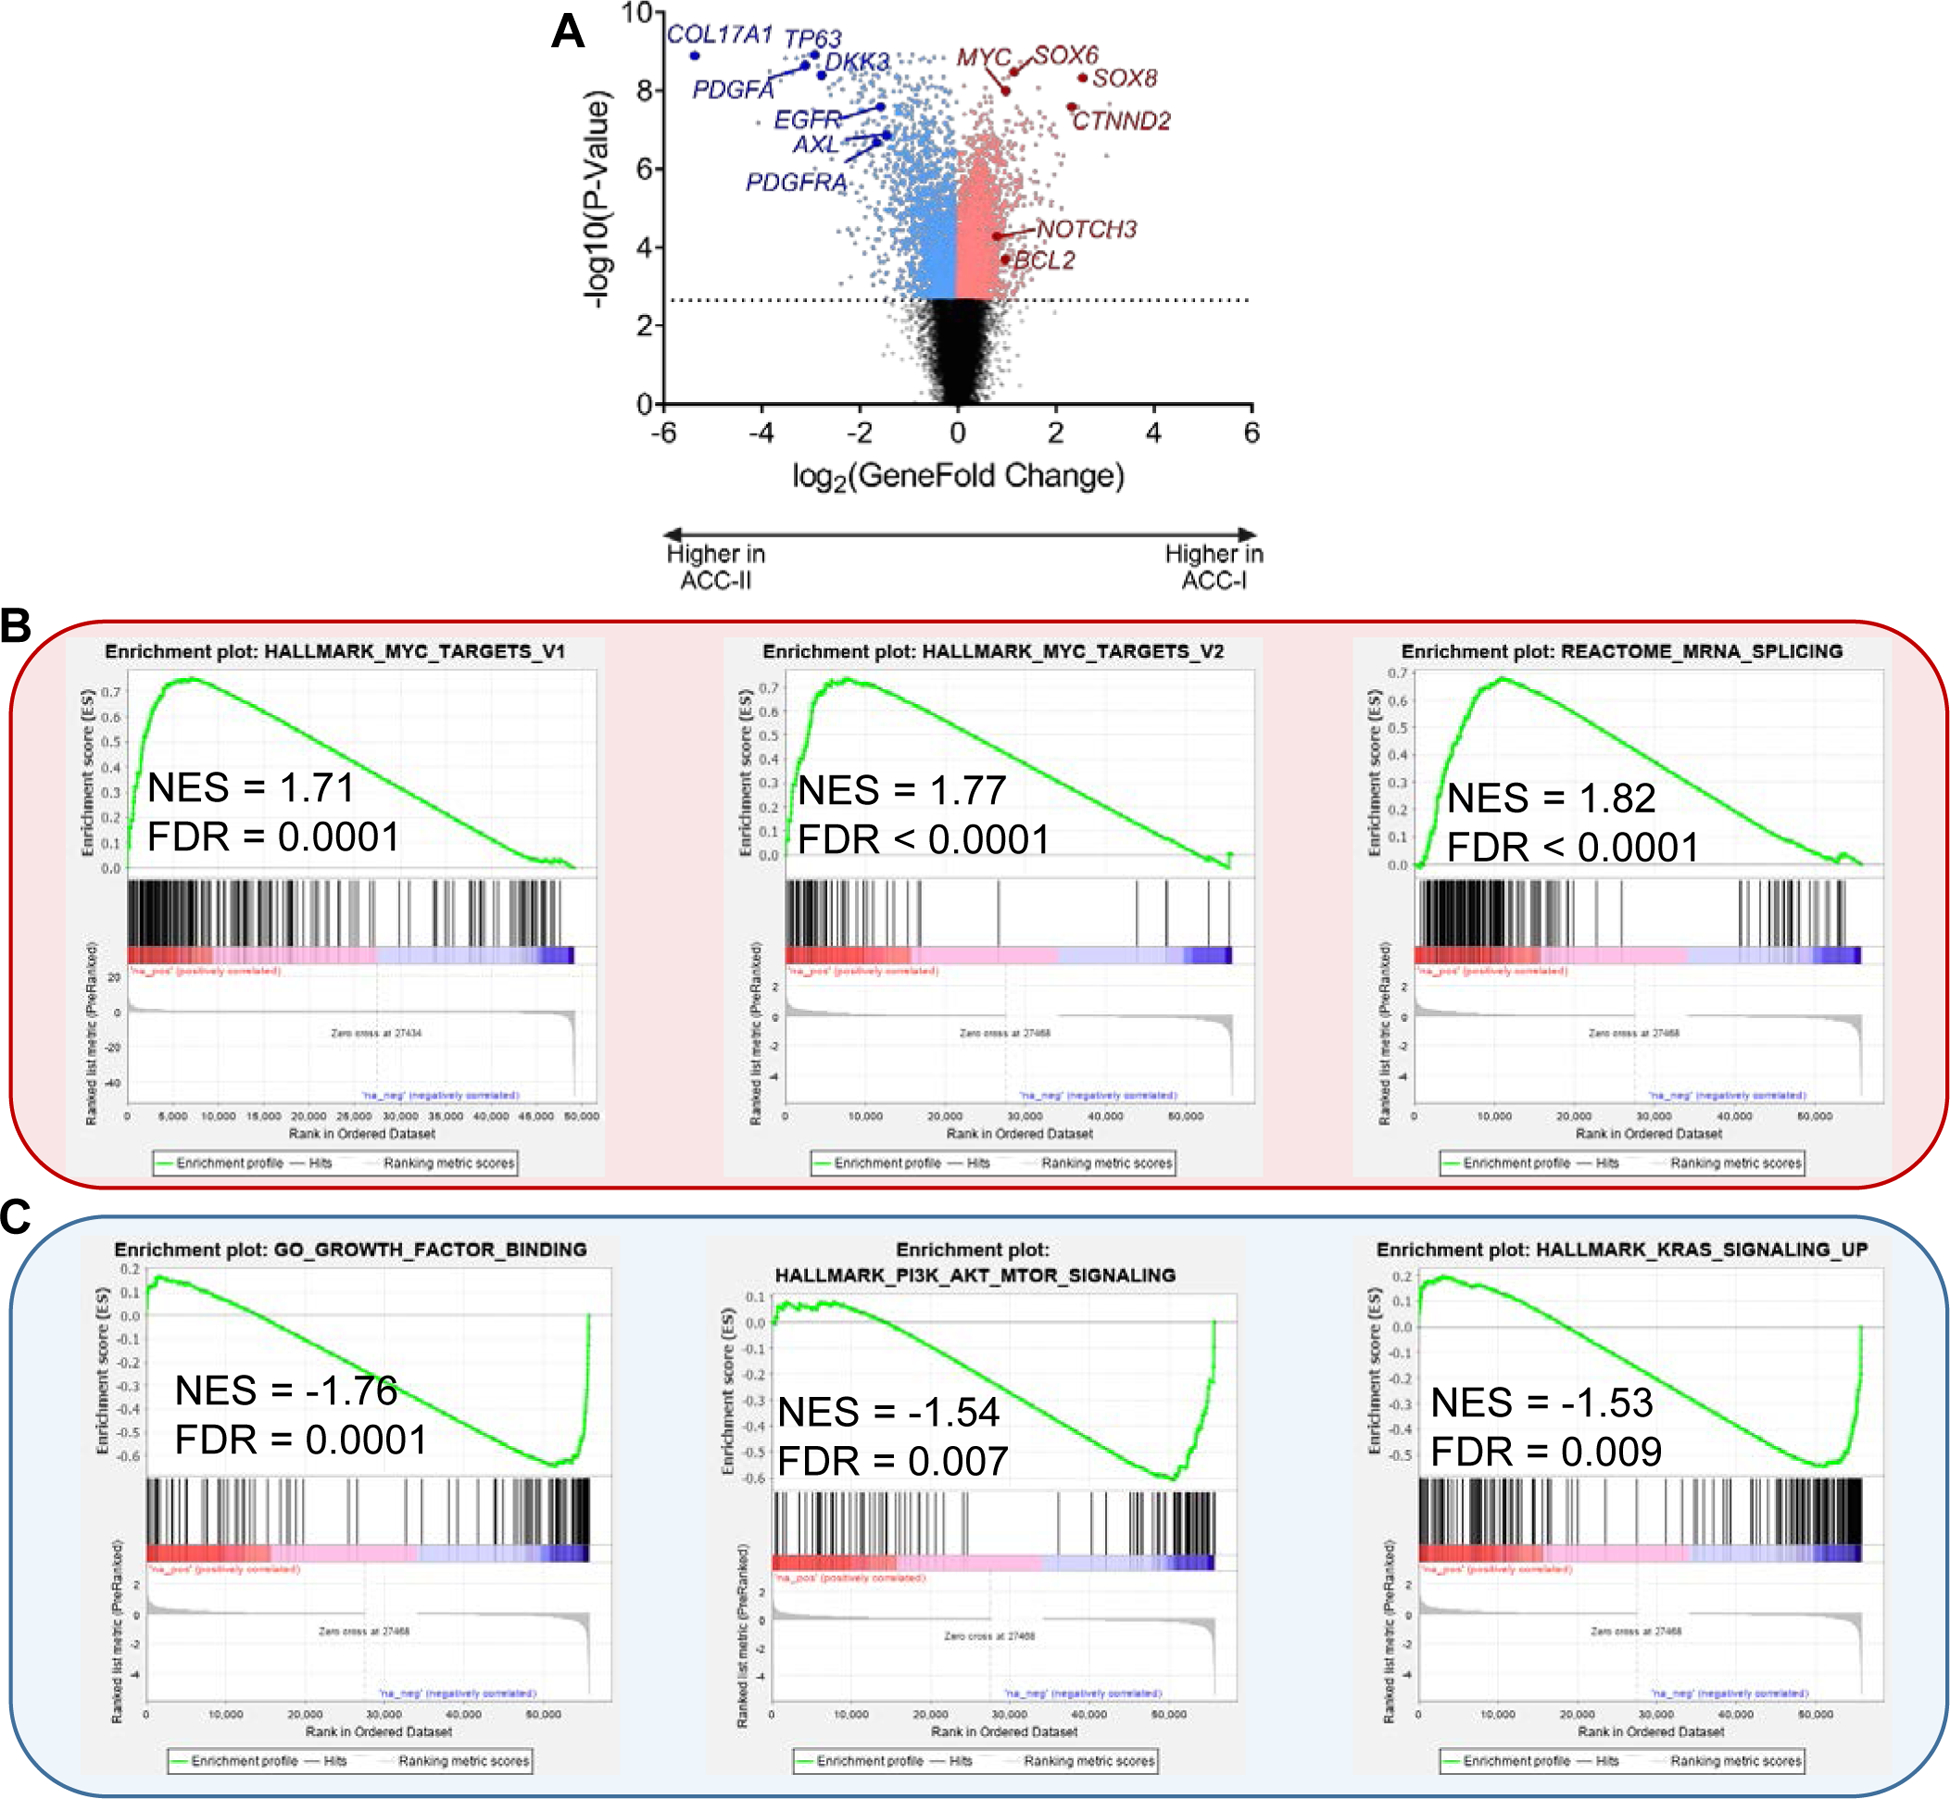
(A) Volcano plot showing genes with increased expression in ACC-I (positive fold changes, red) or ACC-II (negative fold changes, blue). Dotted line indicates 1% FDR.
(B) Pathways enriched in ACC-I by gene set enrichment analysis. NES, net enrichment score.
(C) Pathways enriched in ACC-II by gene set enrichment analysis. NES, net enrichment score.