
Figure 4. Protein expression alterations between ACC subtypes.
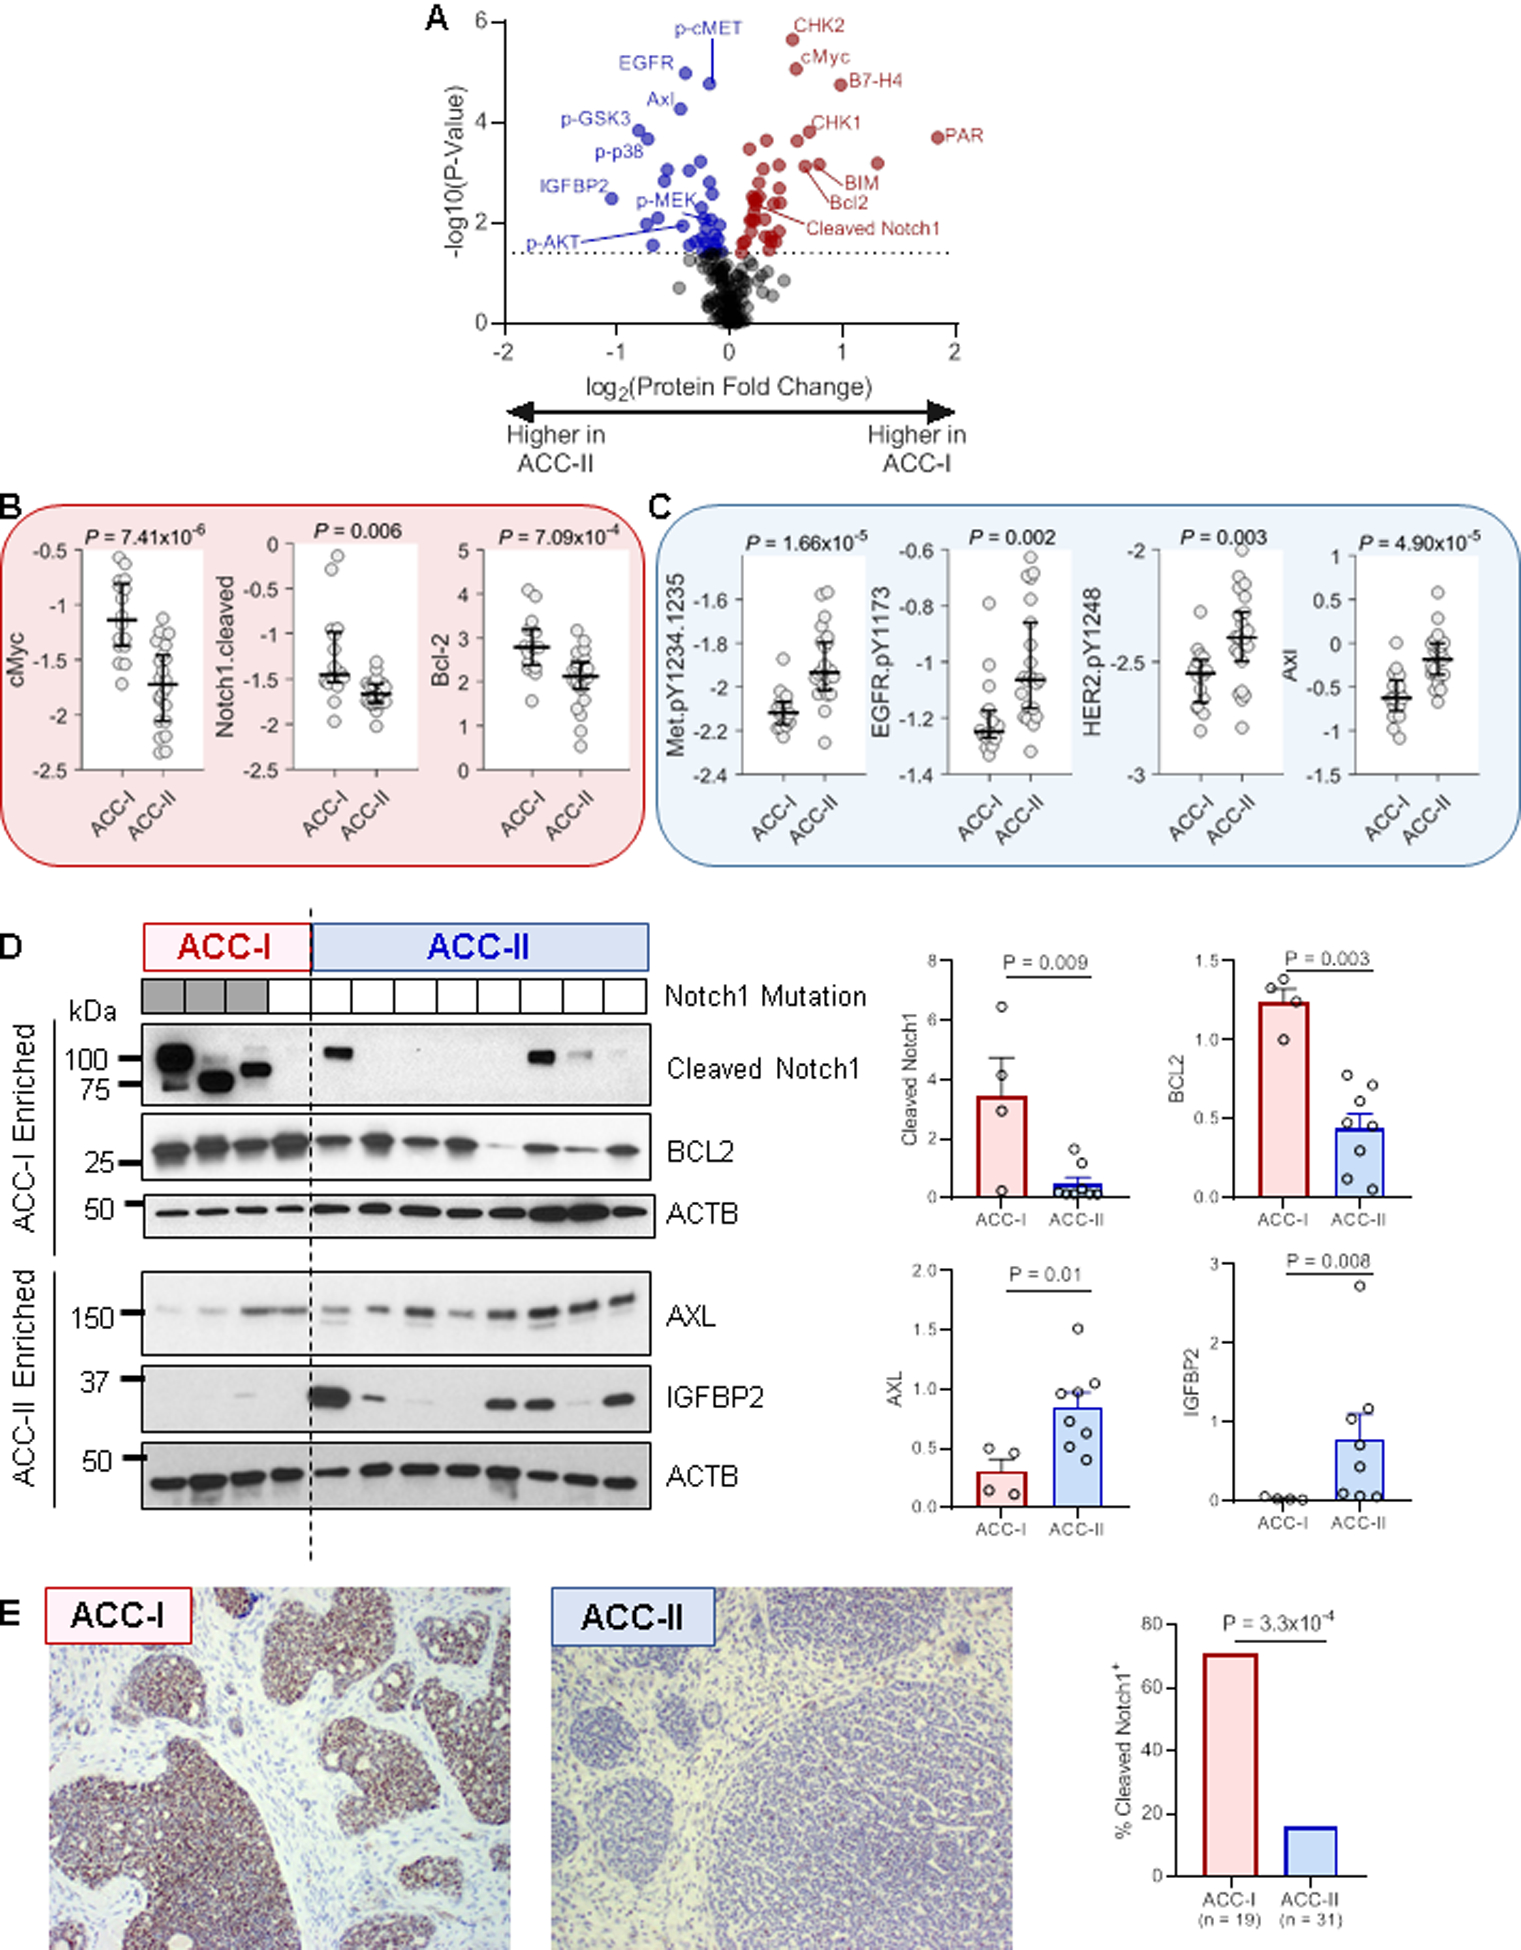
(A) Volcano plot showing proteins with increased expression in ACC-I (positive fold changes, red) or ACC-II (negative fold changes, blue) determined by RPPA. Dotted line indicates 5% FDR.
(B) Select up-regulated proteins in ACC-I. Y-axis indicates protein level determined by RPPA. Rank-sum test.
(C) Select up-regulated proteins in ACC-II. Y-axis indicates protein level determined by RPPA. Rank-sum test.
(D) Validation of select proteins by western blot. Values were normalized to beta actin (ACTB) for quantification. Note that altered cleaved Notch1 band sizes are likely due to mutations altering protein size (full length of NICD1 is 110 kD). Rank-sum test.
(E) Validation of cleaved Notch1 by IHC. Fisher’s exact test.