
Figure 5. MYC and p63 are sufficient to identify patients with poor prognosis across multiple independent ACC cohorts.
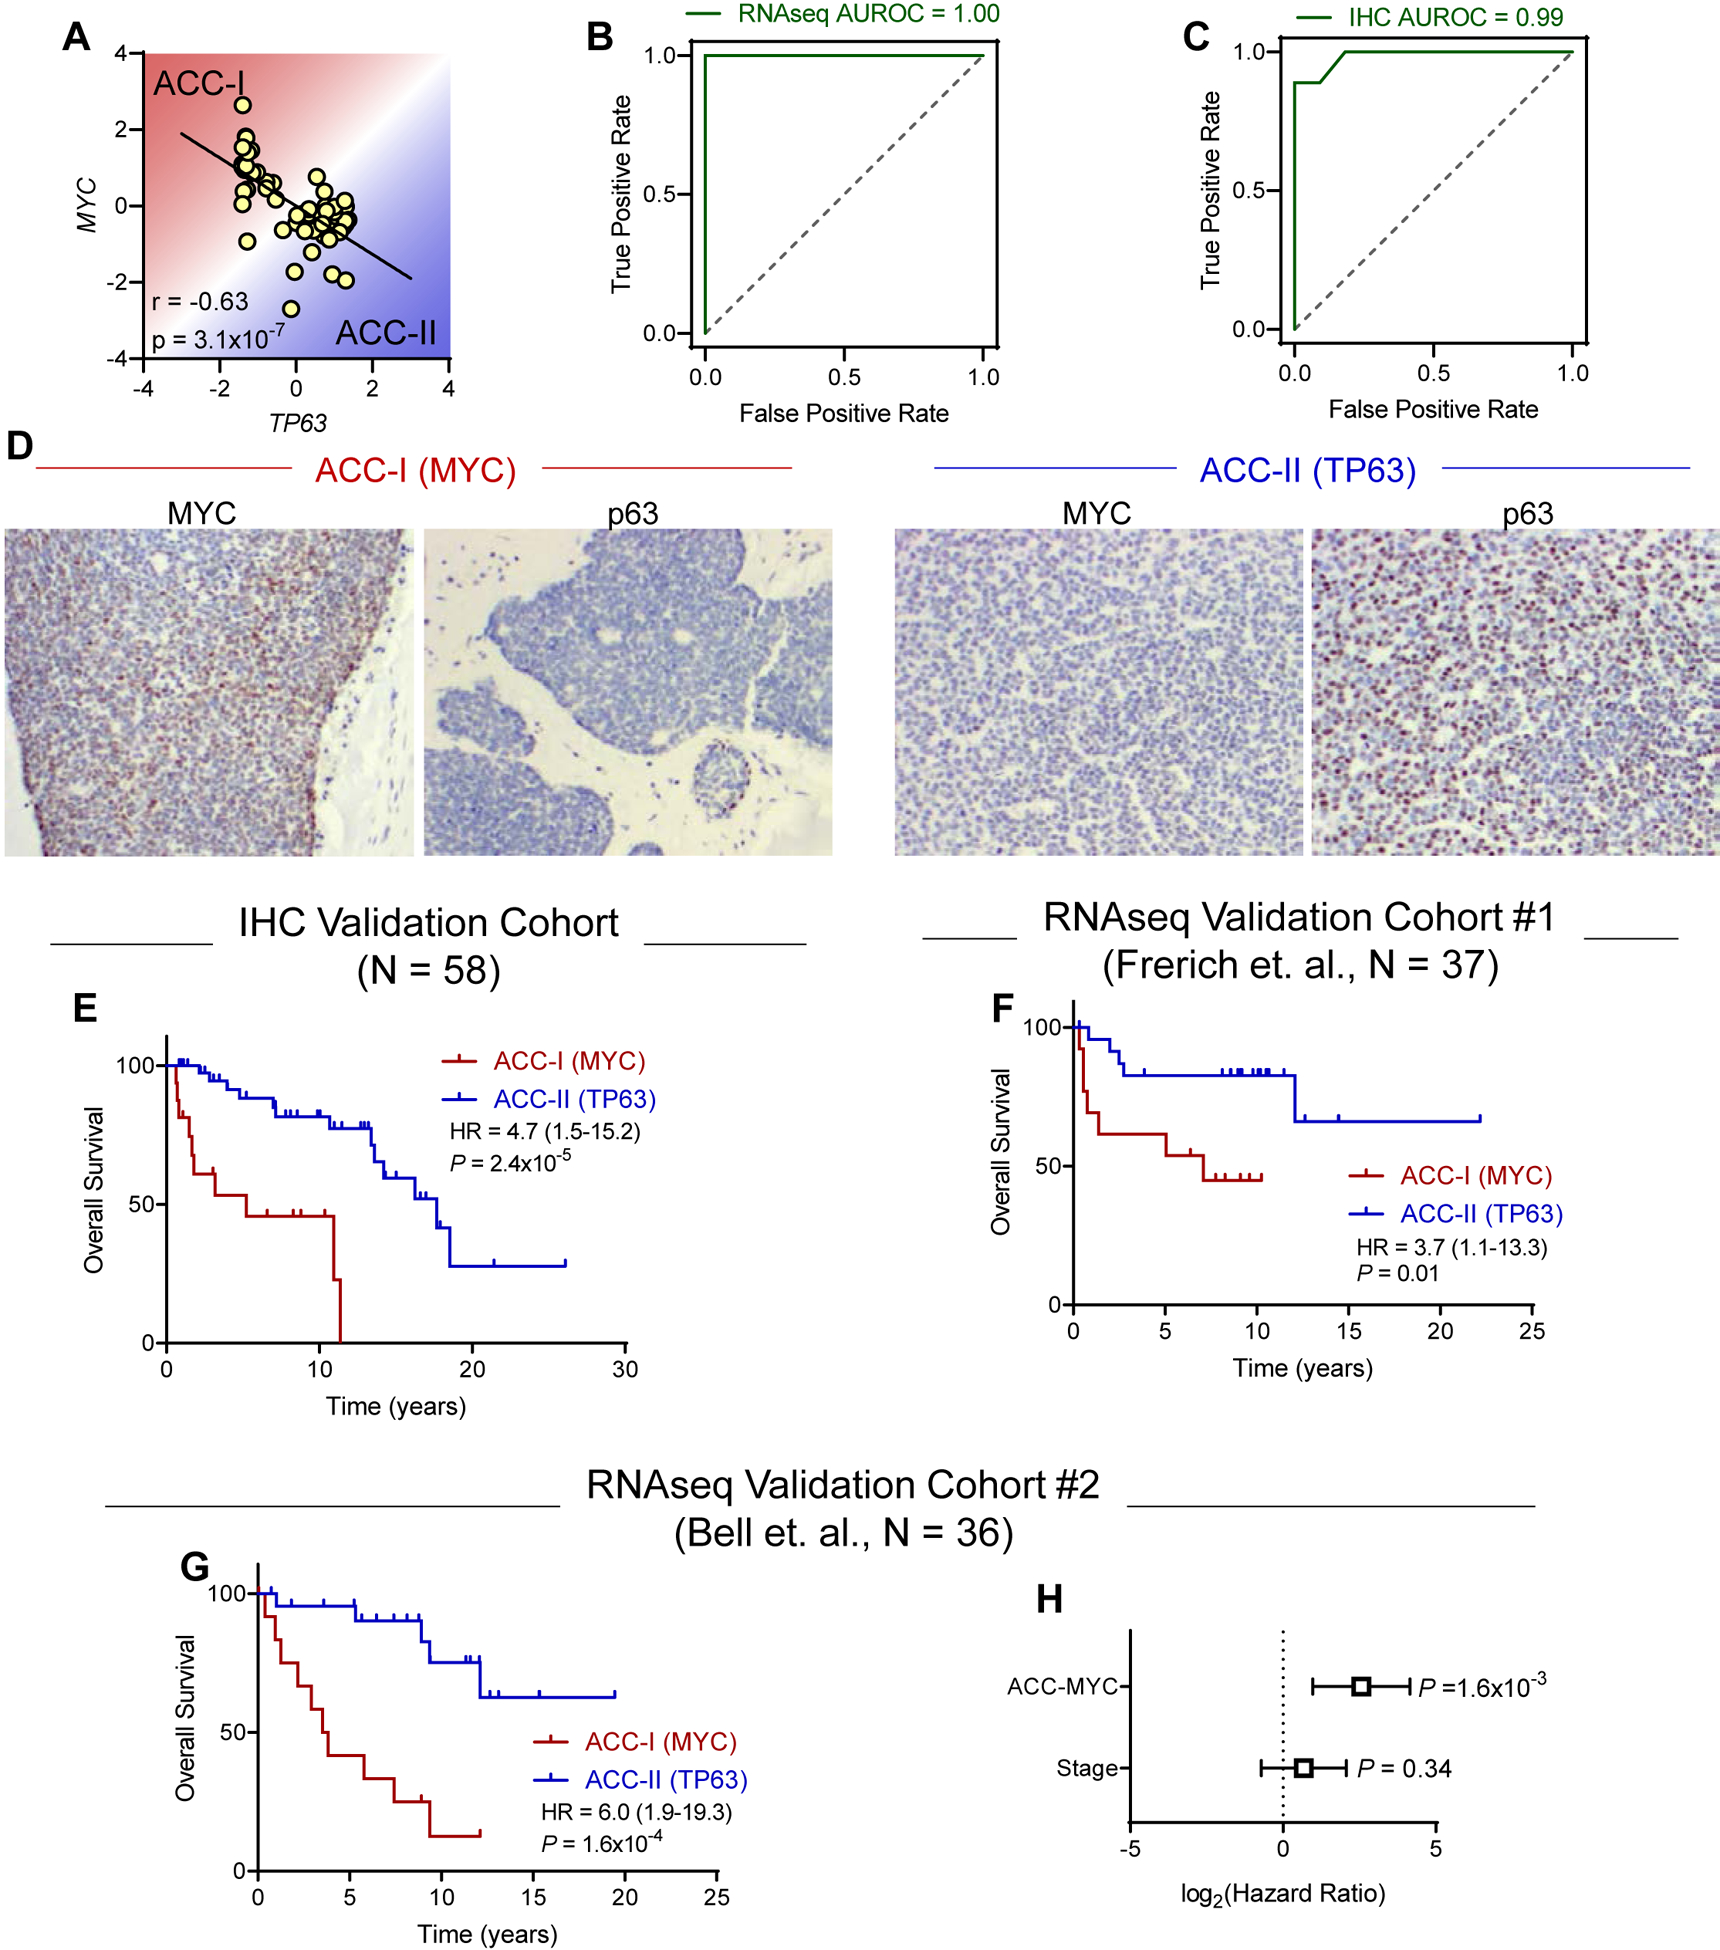
(A) Correlation of MYC and TP63 gene expression levels. Pearson correlation coefficient. N = 54.
(B-C) Receiver-operator characteristic (ROC) curve for the ability of MYC/TP63 gene expression (C) or IHC (D) levels to identify ACC subtypes. Area under ROC curve (AUROC) of 1.0 indicates perfect classification. Dotted line indicates random chance.
(D) Representative immunohistochemical staining for MYC and p63 in tumors from each subtype.
(E) Validation of MYC/TP63 IHC classification in independent cohort of ACC samples (N = 58). Log-rank test.
(F) Validation of MYC/TP63 classification in independent Frerich cohort (N = 37). Samples were divided based on optimal threshold value determined in the original cohort. Log-rank test.
(G) Validation of MYC/TP63 classification in independent Bell cohort (N = 36). Samples were divided based on optimal threshold value determined in the original cohort. Log-rank test.
(H) Multivariate survival analysis using Cox proportional hazards model in Bell validation cohort.