
Figure 1. Genomic and biochemical characterization of a panel of MPNST cell lines including sensitivity to MEK inhibition.
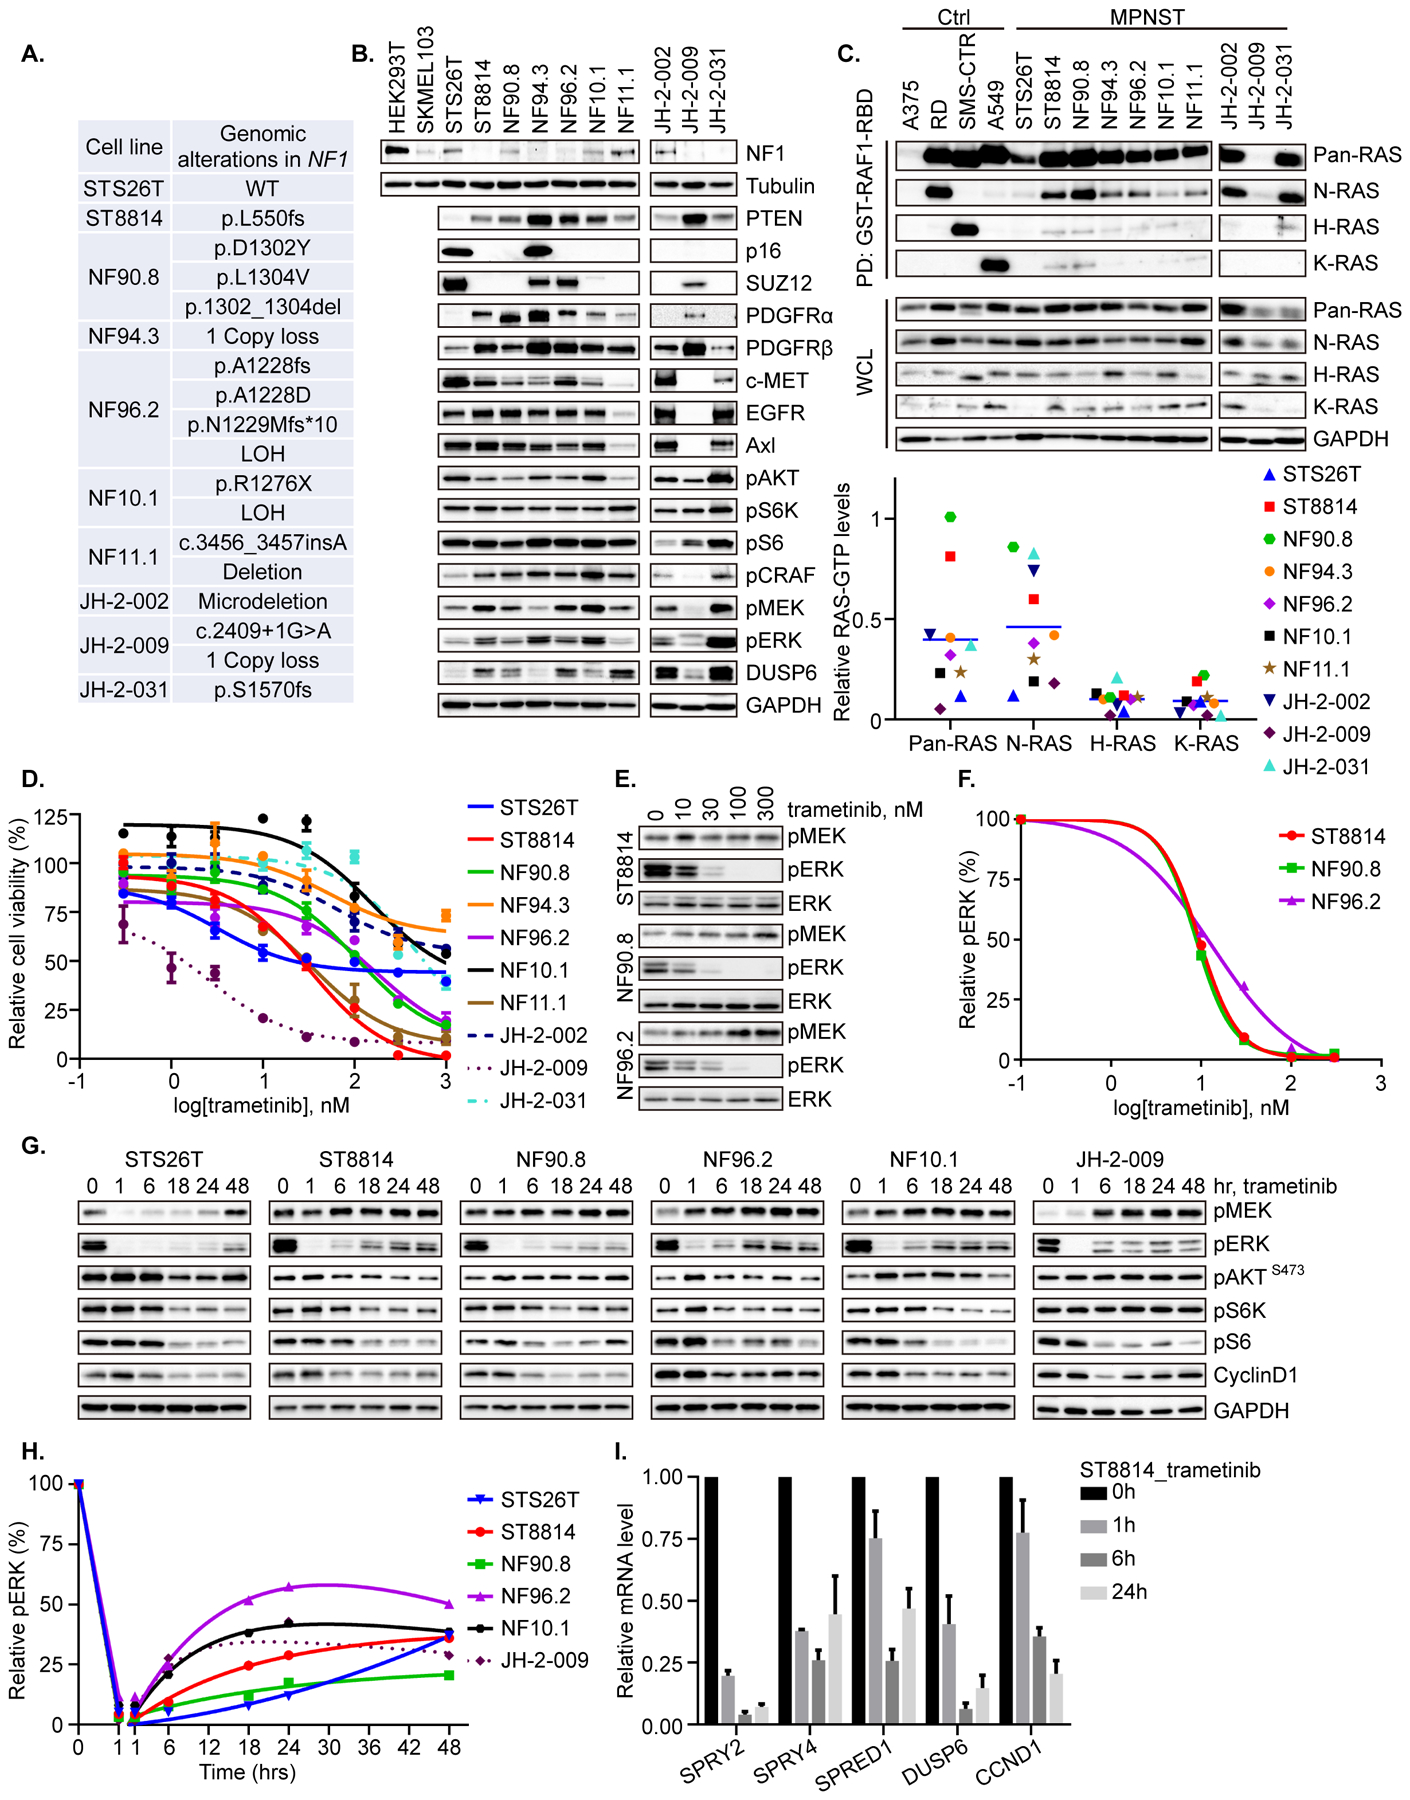
A. Genomic alterations in NF1 were detected by targeted gene sequencing or whole exome sequencing (WES) in ten MPNST cell lines. LOH = Loss of heterozygosity. B. Steady state expression level of the indicated proteins was determined by immunoblot in the ten MPNST cell lines. HEK-293T and SKMEL-103 cells were used as positive and negative controls for NF1 protein expression, respectively. C. An active Ras pull-down assay, using immunoprecipitation with GST-RAF1-RBD, was used to isolate GTP-bound RAS, and isoform-specific activity was determined using antibodies against pan-RAS, NRAS, HRAS and KRAS, as shown. A375 (BRAF V600E melanoma), RD (NRAS Q61H, rhabdomyosarcoma), SMS-CTR (HRAS Q61K, rhabdomyosarcoma), and A549 (KRAS G12S, NSCLC) were used as negative control (A375), and positive controls for NRAS (RD), HRAS (SMS-CTR) and KRAS (A549). The signal intensity of RAS-GTP was quantified using densitometry analysis. N-/H-/K-RAS-GTP levels in MPNST cells were normalized to the levels in N-/H-/K-RAS mutant cells, respectively. Pan-RAS-GTP level in MPNST was normalized to the average level of N-/H-/K-RAS mutant cells. D. Cell viability in response to the MEK inhibitor trametinib was evaluated by high-throughput colorimetric assay and graphed as percent viability relative to untreated cells. E. ST8814, NF90.8 and NF96.2 cells were treated with increasing concentrations of trametinib for 1 hr. phospho-MEK, phospho-ERK and total ERK were detected by immunoblot. F. Phospho-ERK signal intensity in E was quantified using densitometry analysis and graphed as a function of trametinib dose. G. Six MPNST cell lines were treated with trametinib (20 nM) over a time course. The indicated proteins were detected by immunoblot. H. Phospho-ERK signal intensity in G was quantified using densitometry analysis. I. Real-time PCR was used to measure mRNA levels of representative genes in the ERK-dependent transcriptional output profile in response to trametinib (20 nM) in the ST8814 cell line. Results were from the average of three independent biological replicates. Phospho-proteins and total proteins were from separate blots in B, C, E and G.